DW Simpson is proud to provide previous Actuarial Salary Surveys. Each year we conduct a survey of the actuarial industry to provide the most accurate and timely data available, making our Salary Survey the industry standard. The following graphs are for the U.S. market.
Are you an Actuary interested in participating in our Annual Salary Survey?
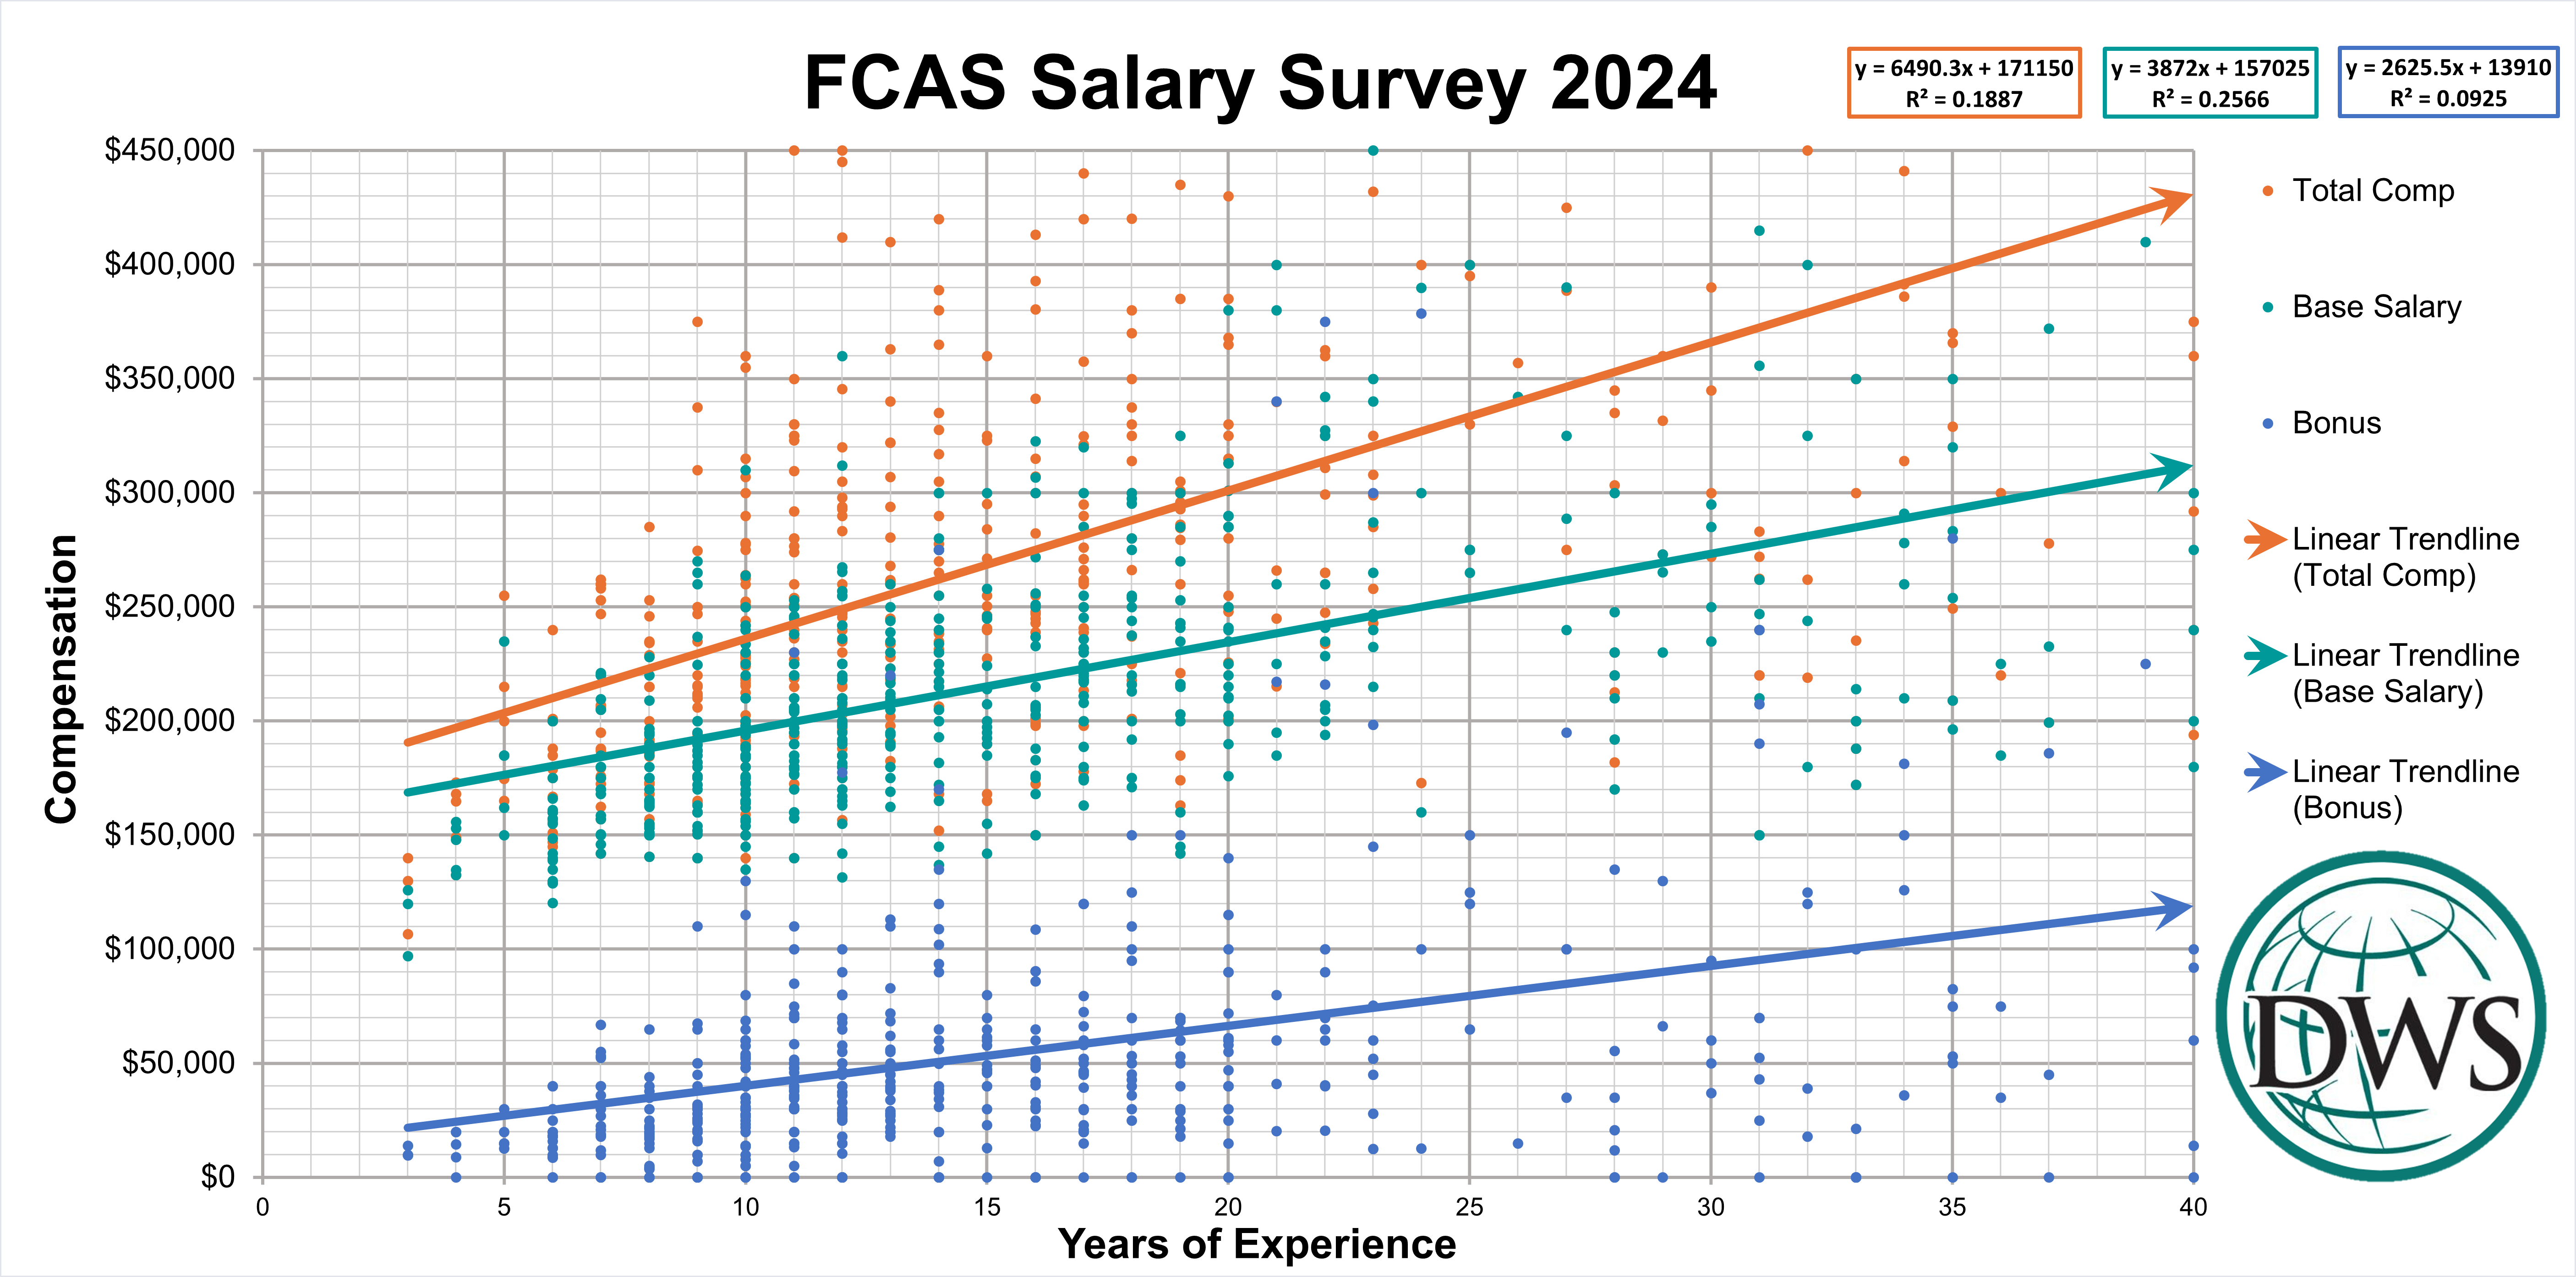
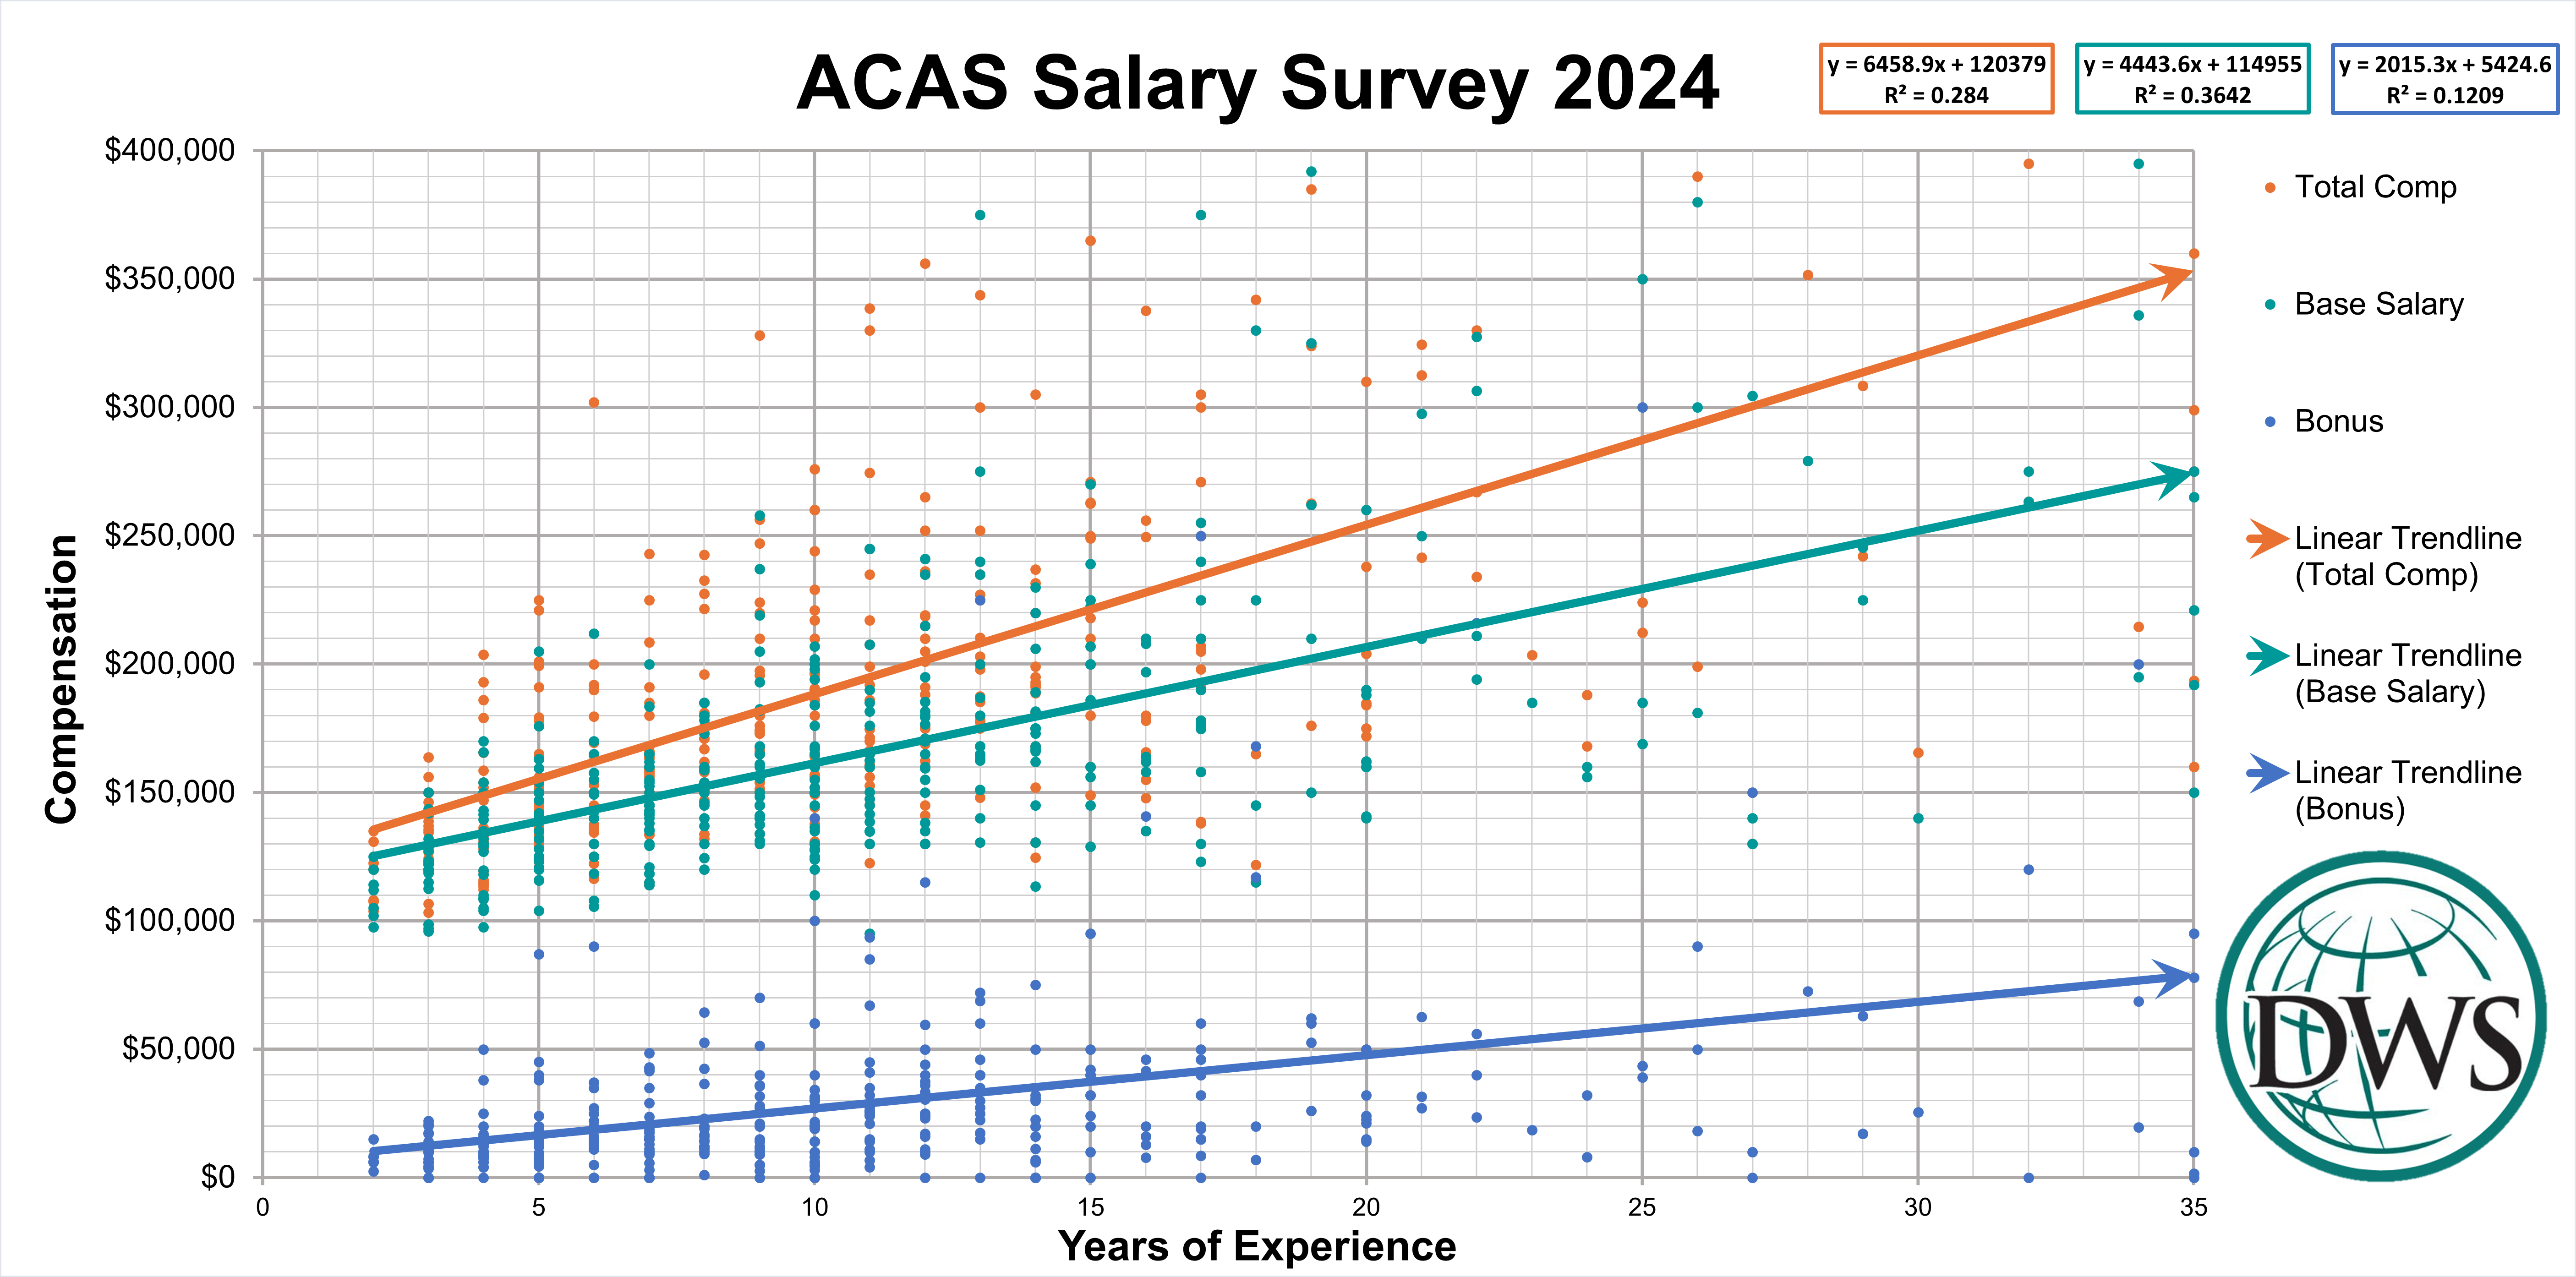
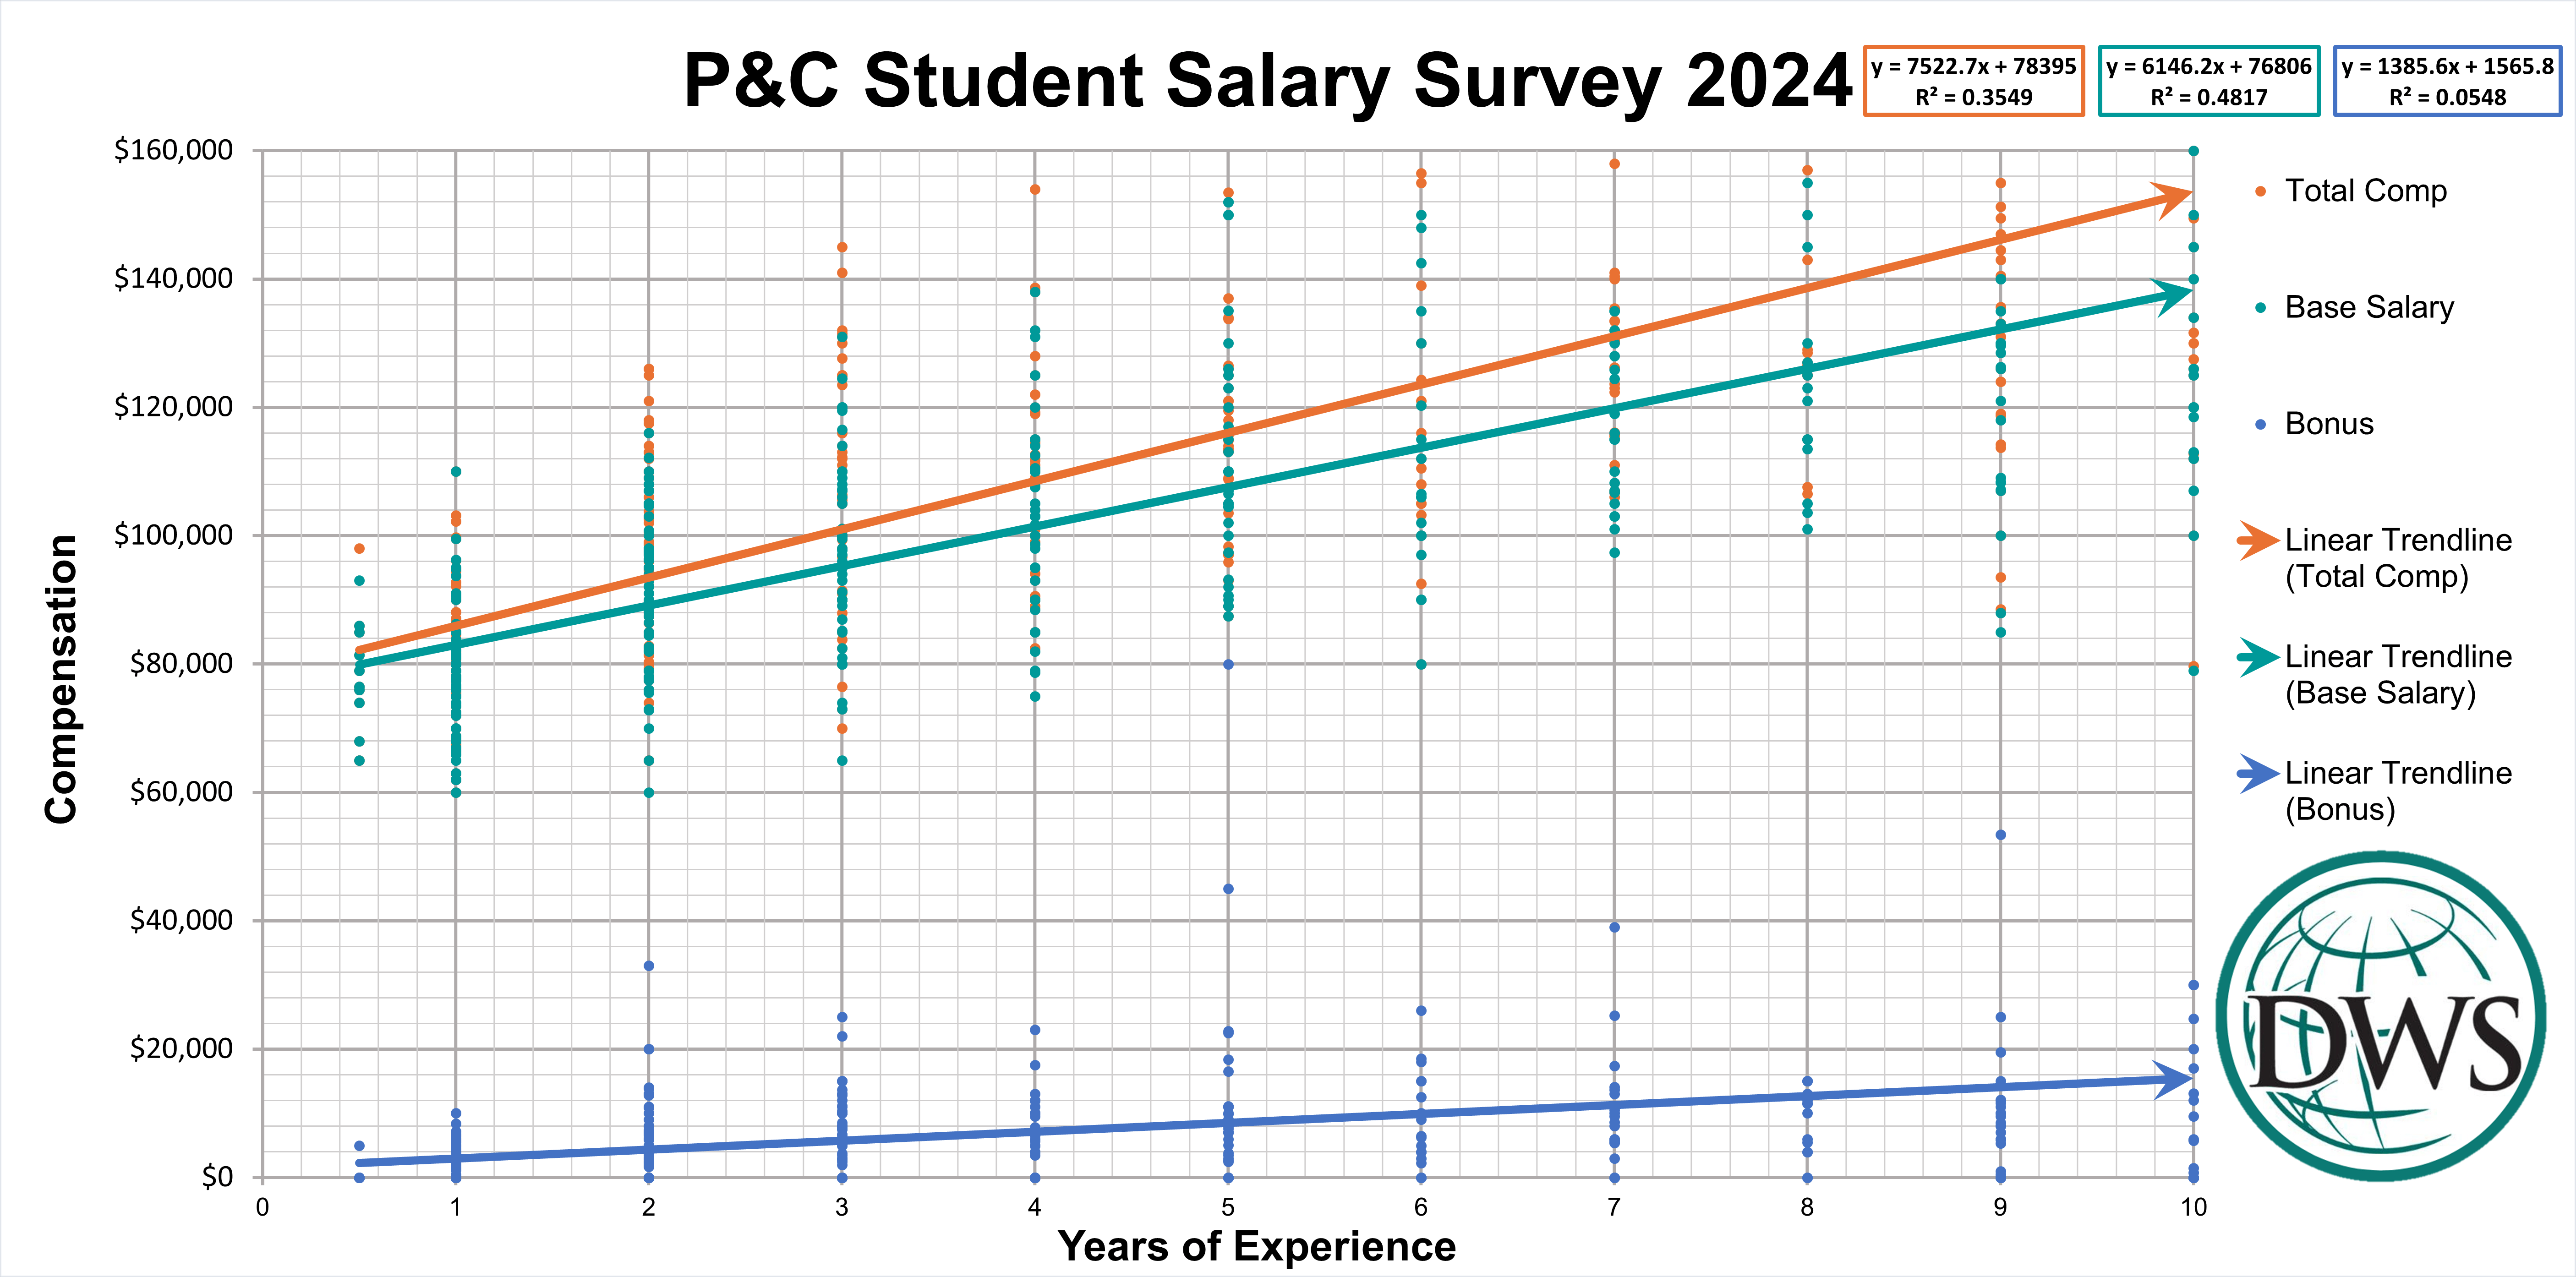
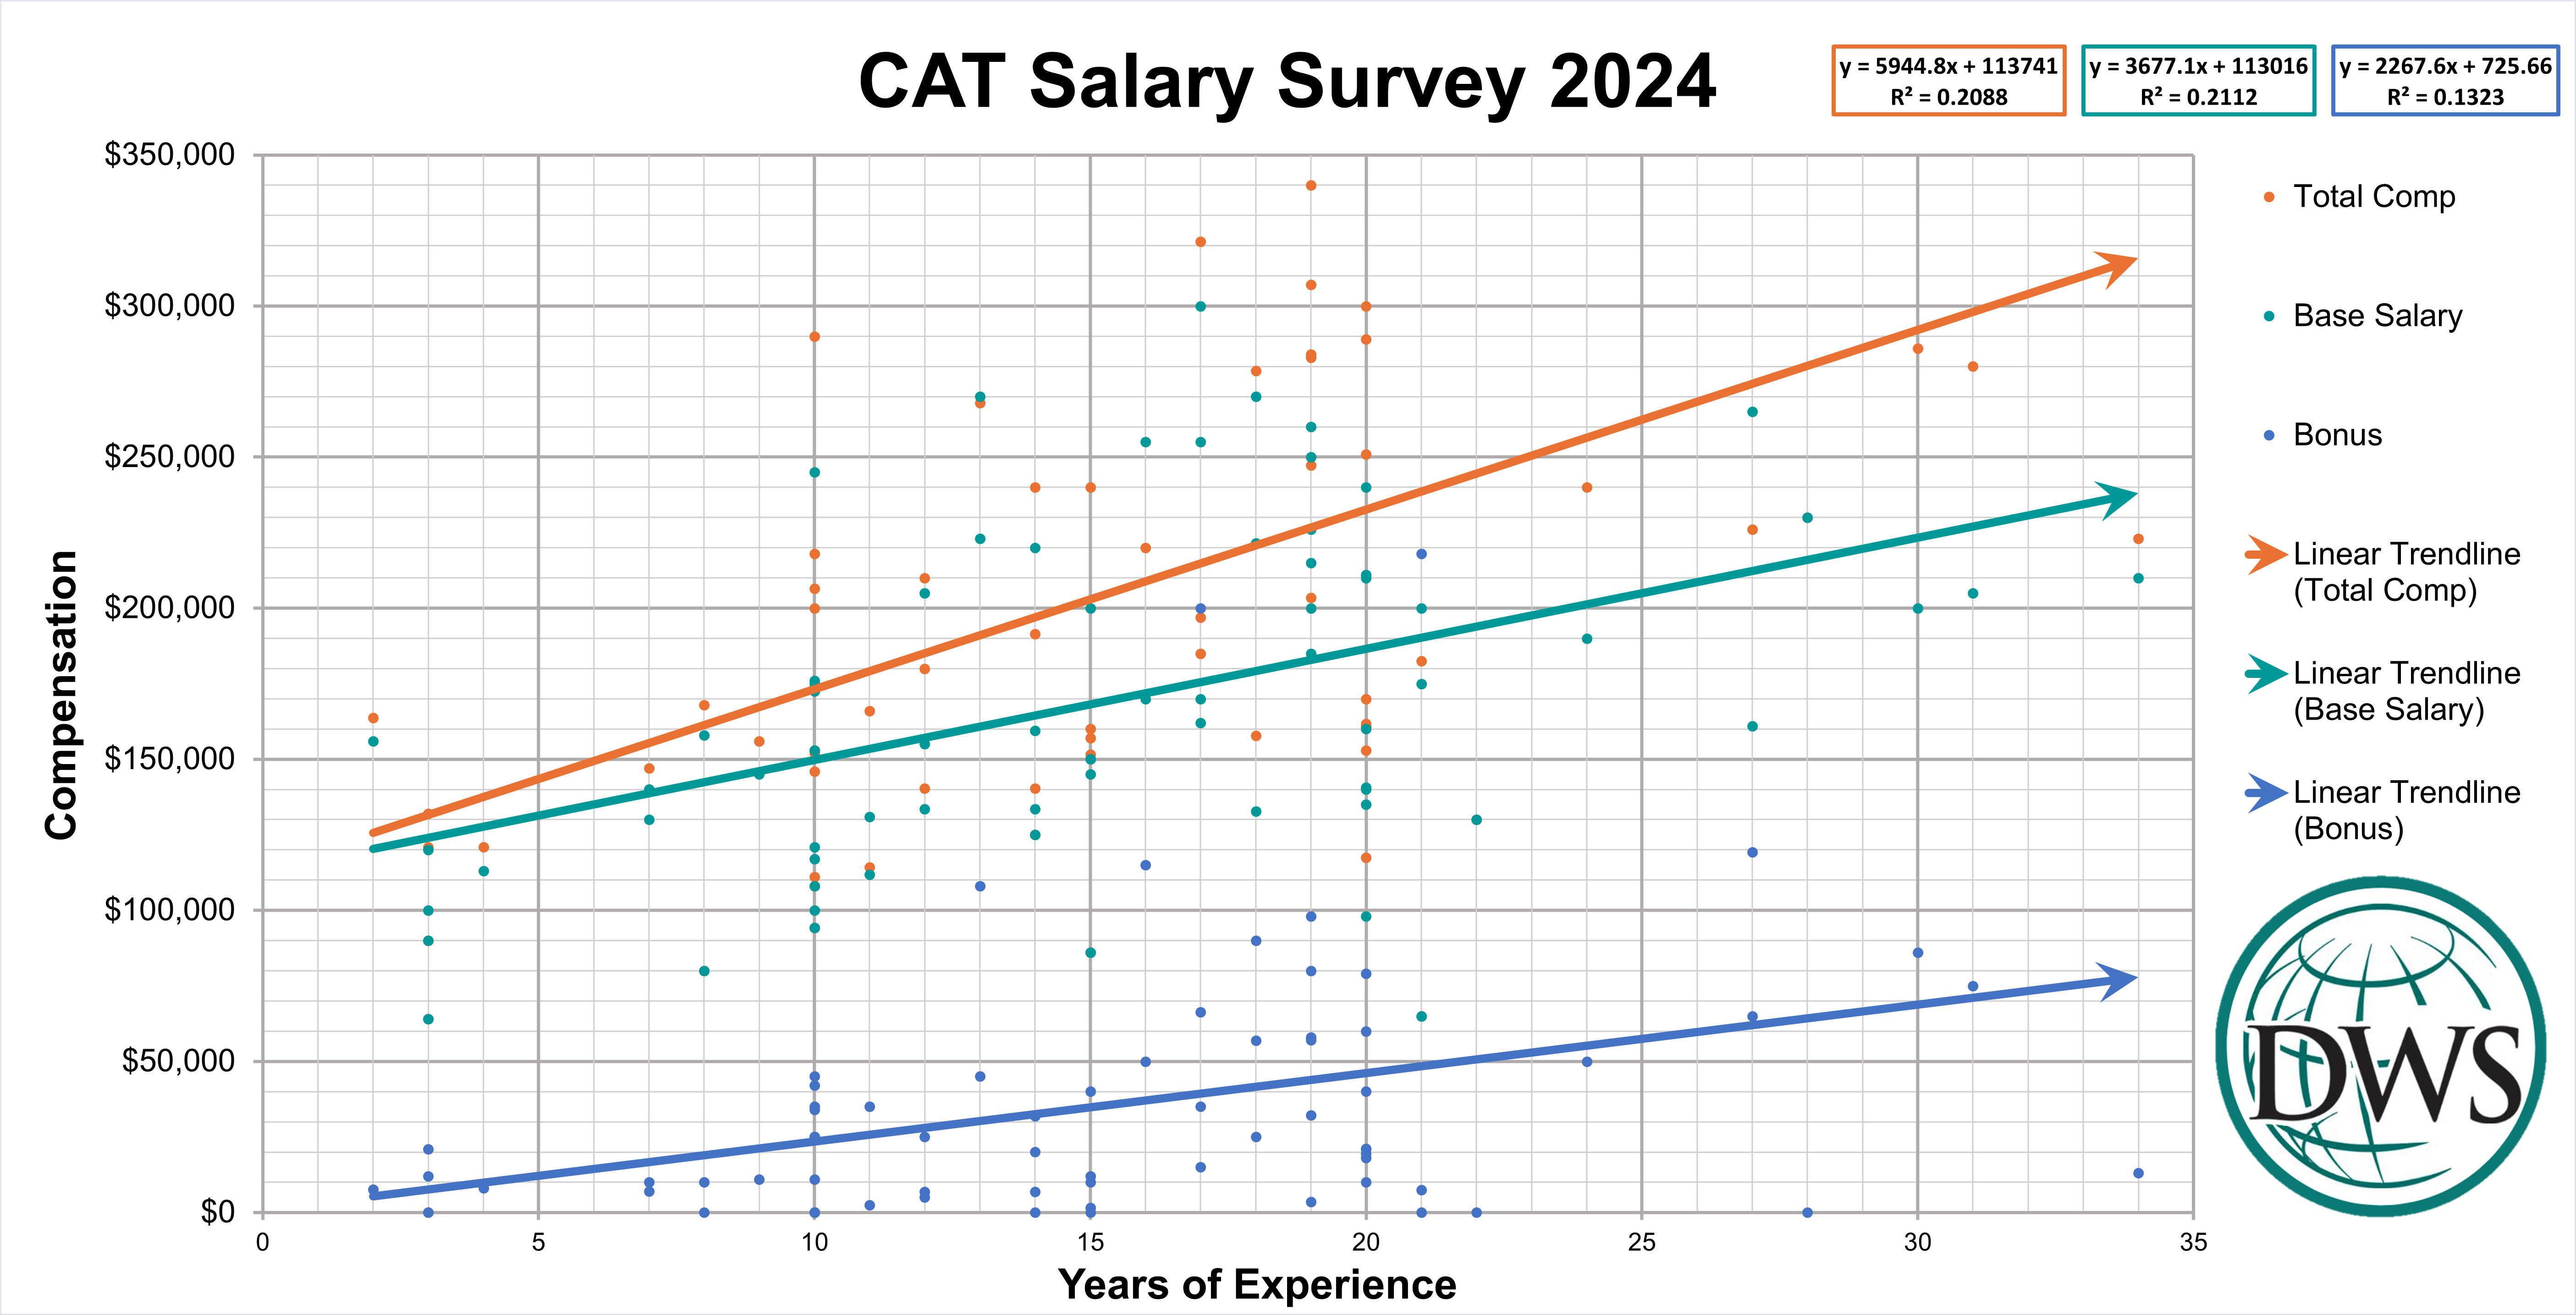
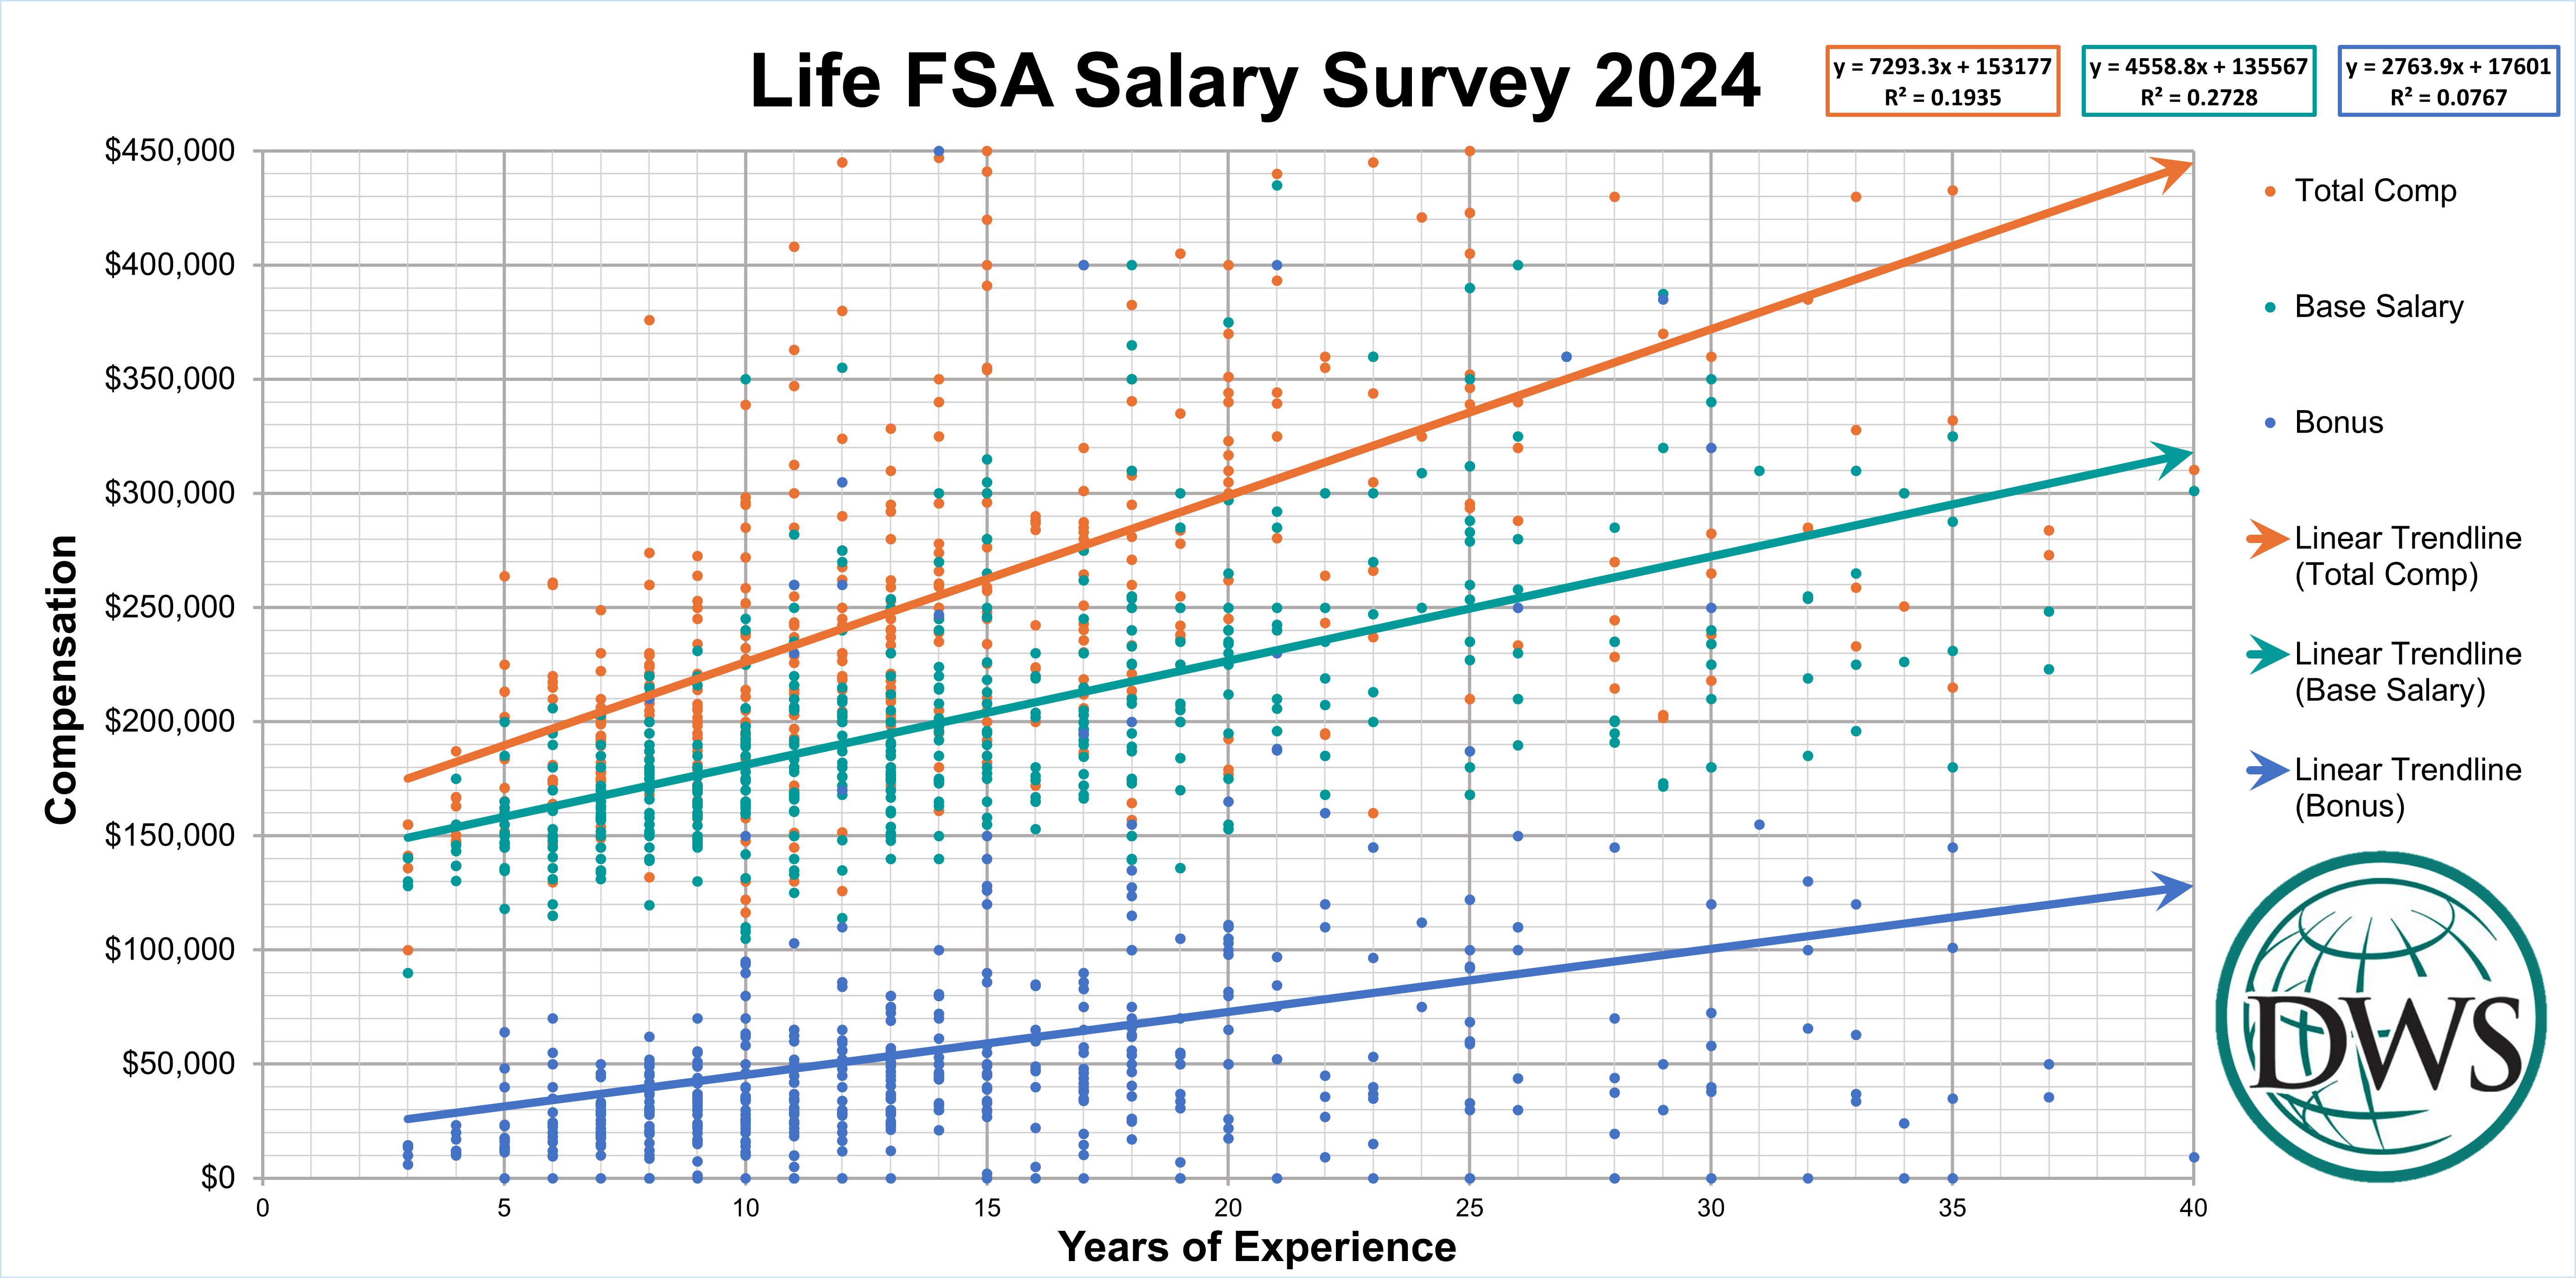
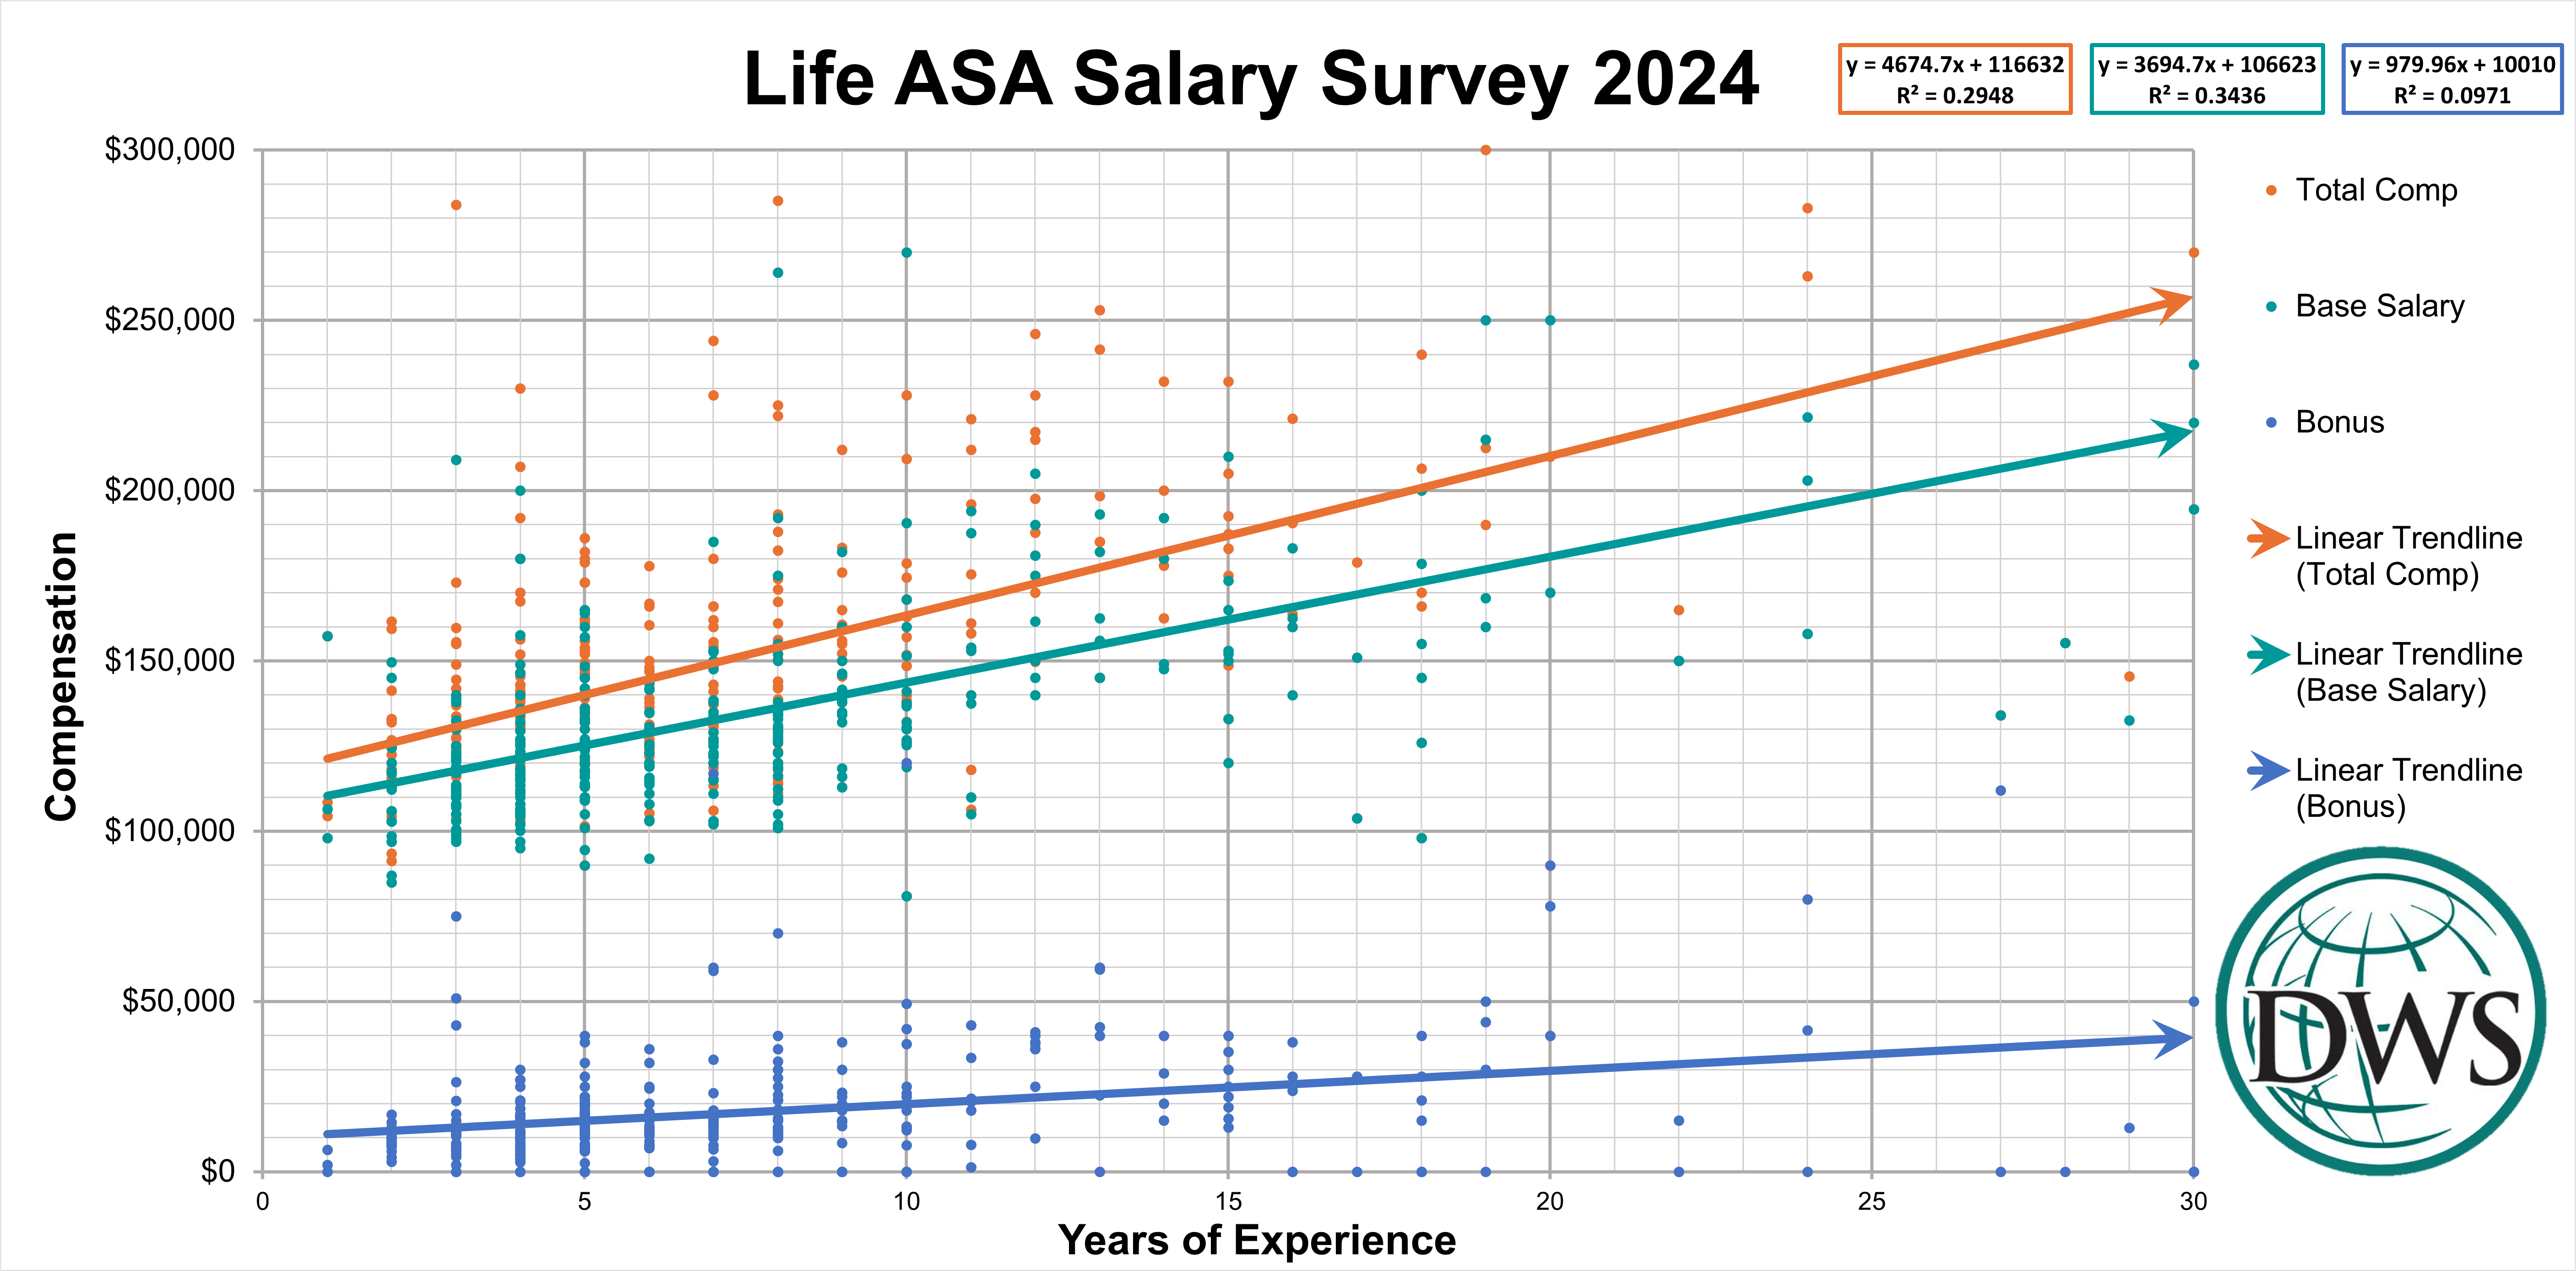
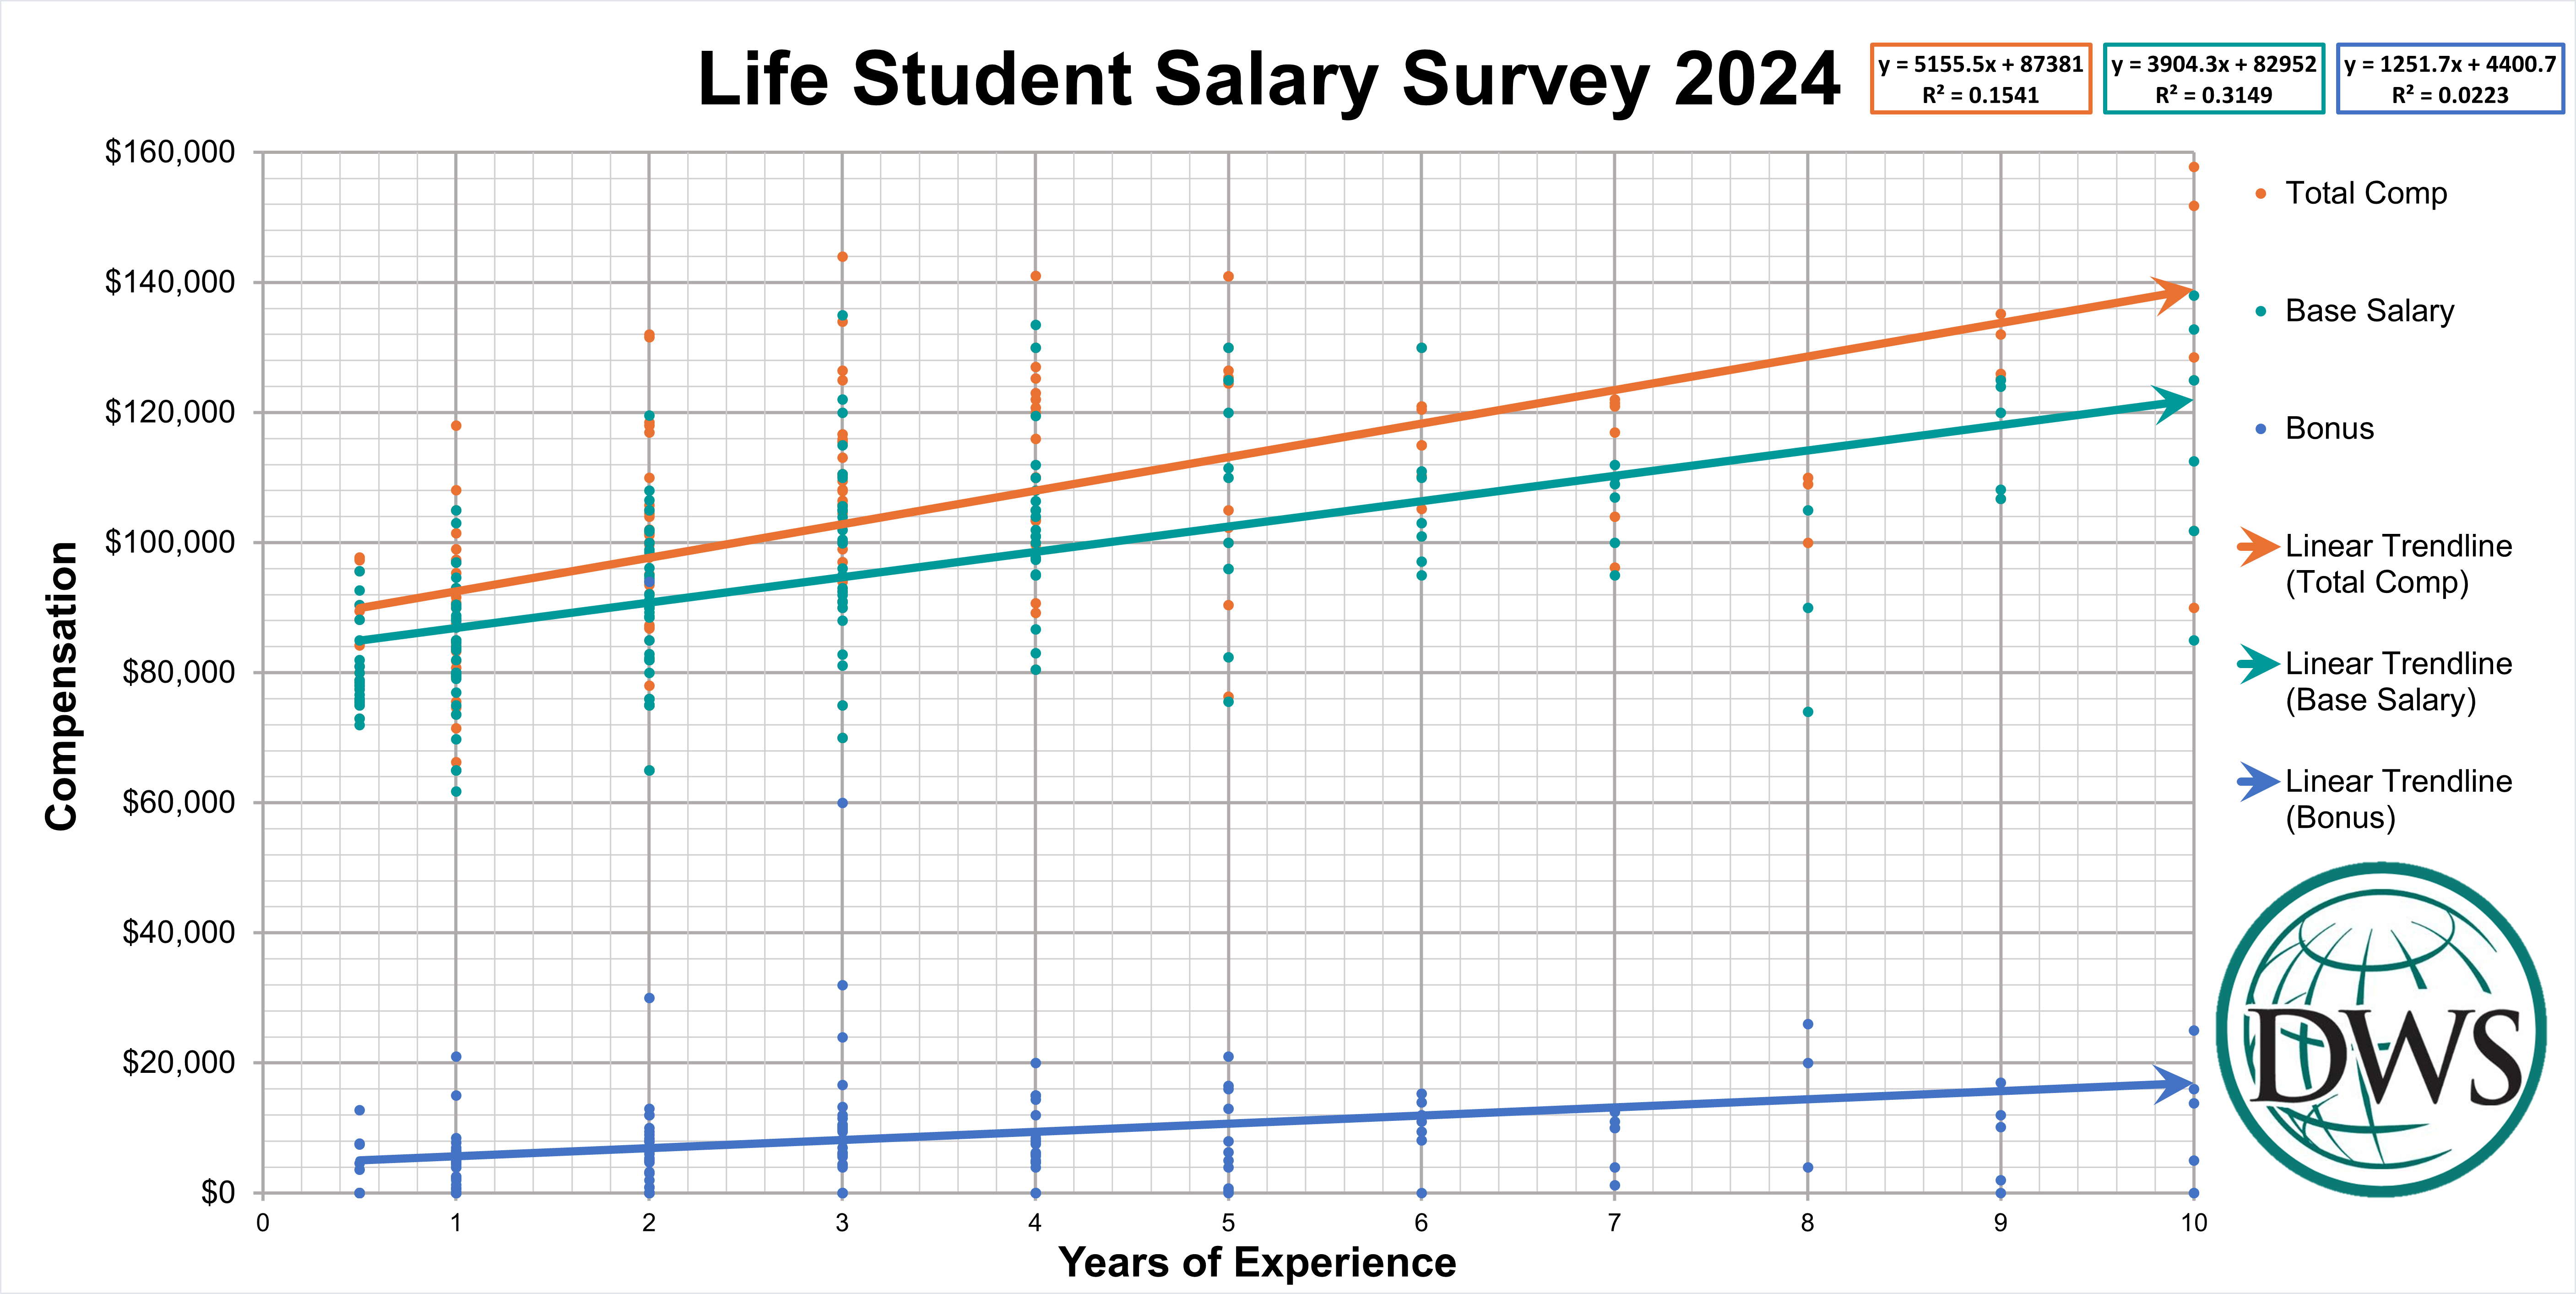
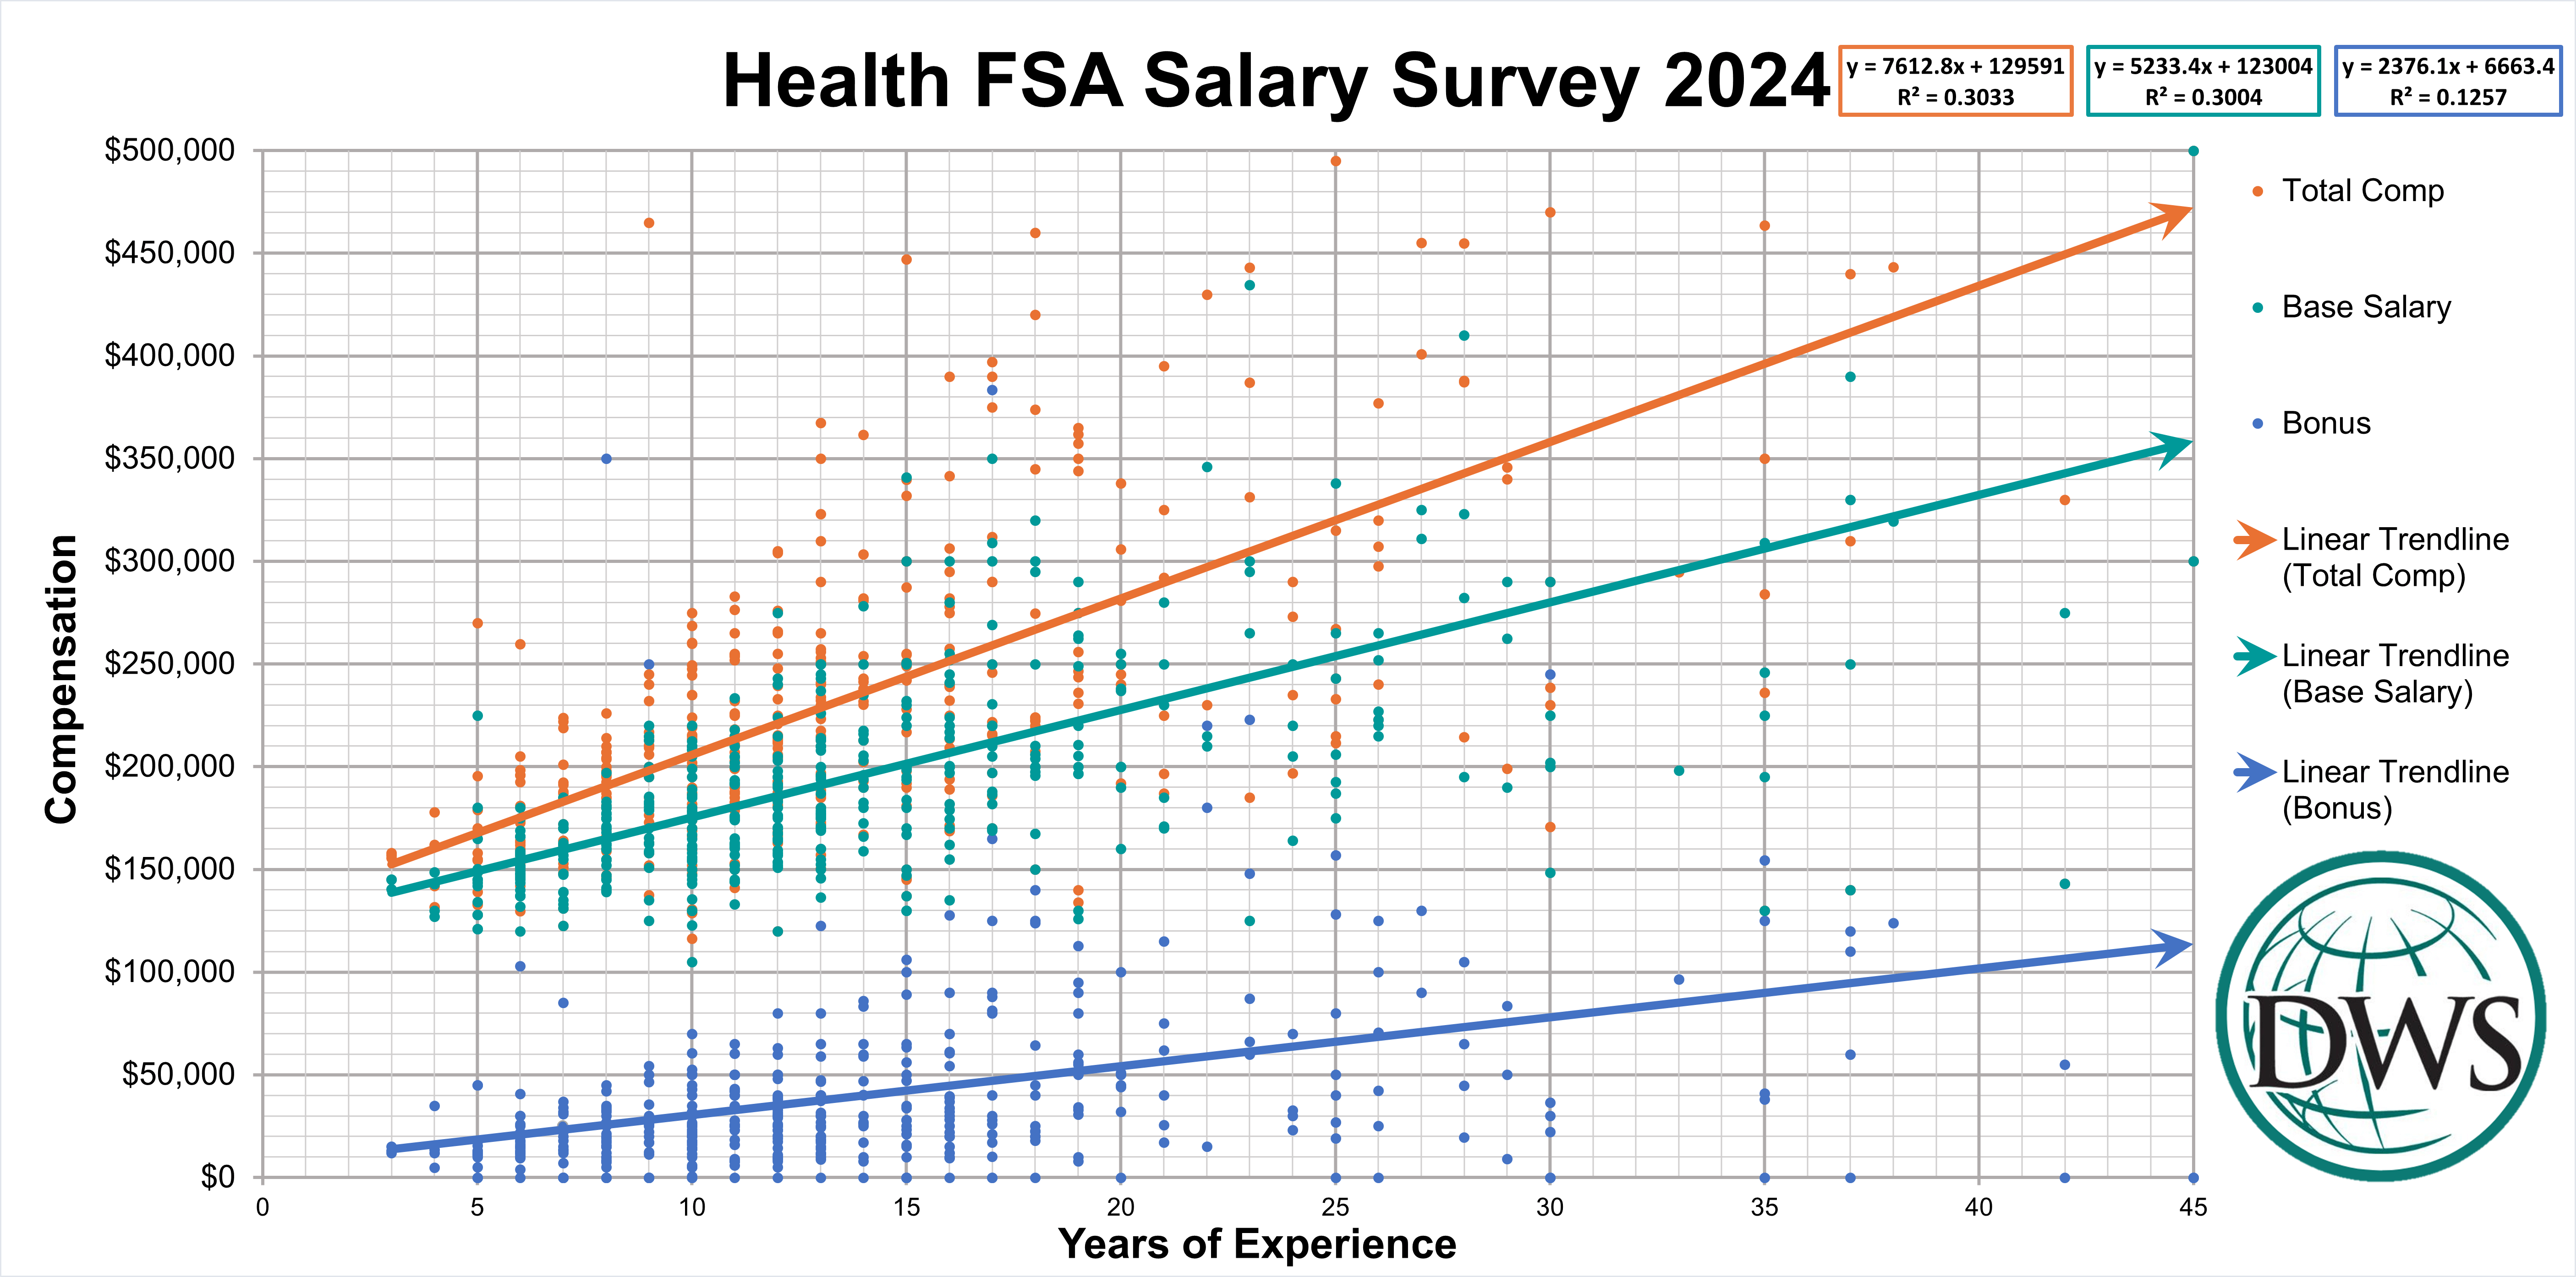
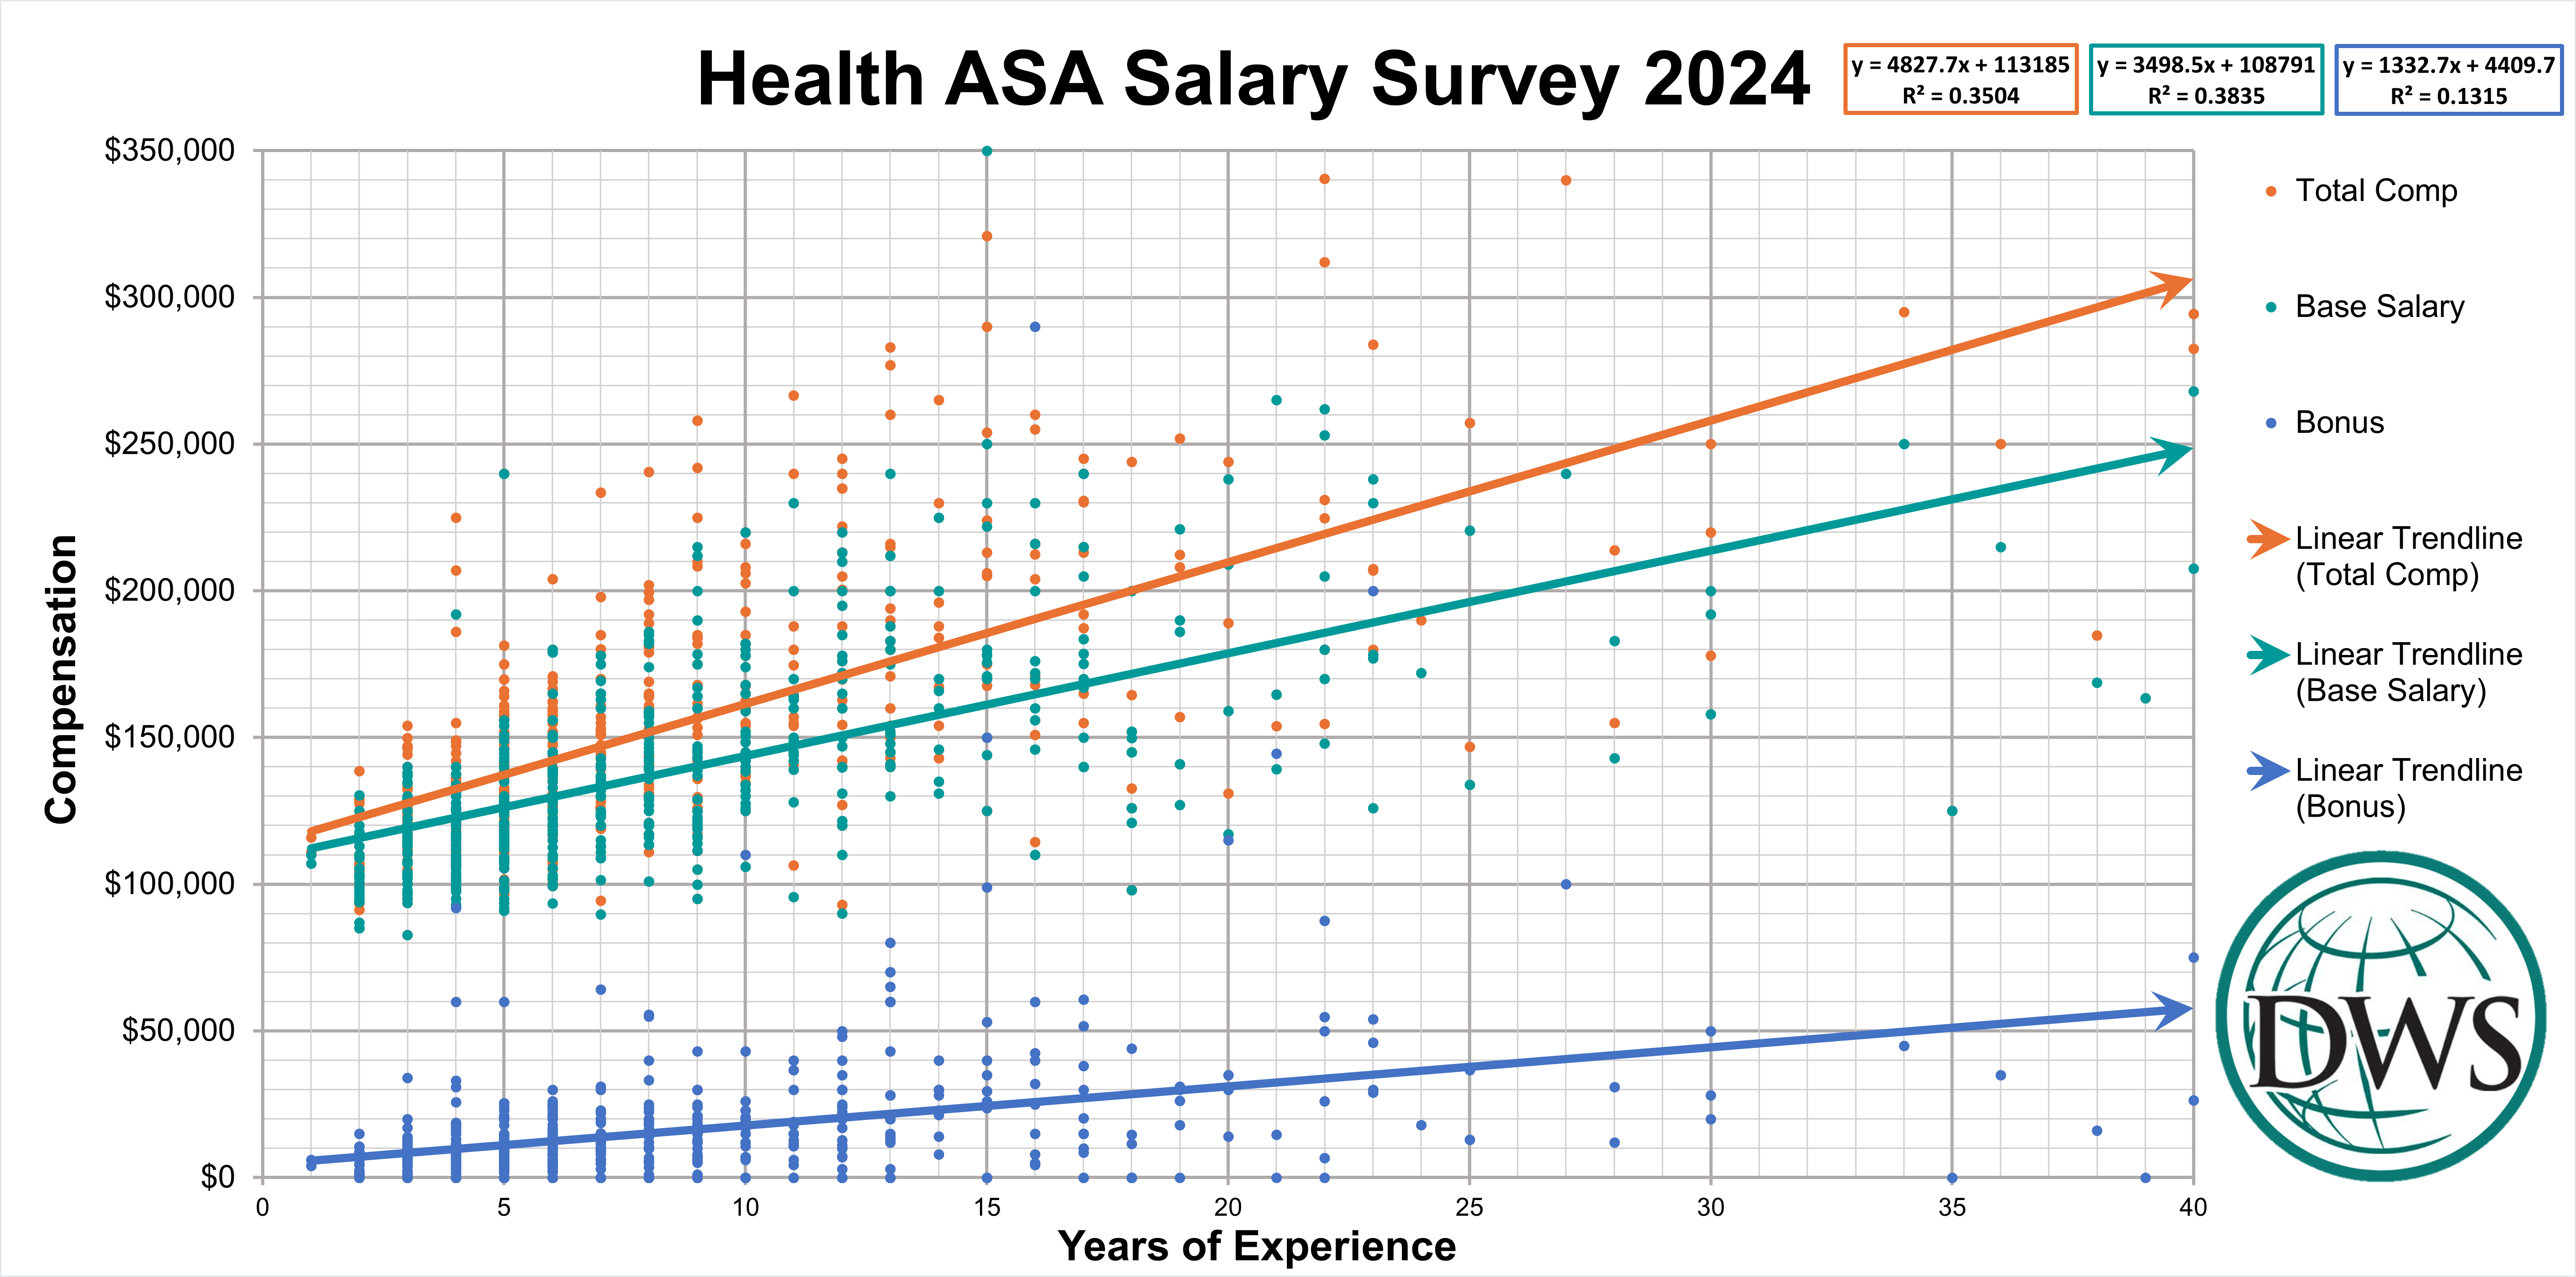
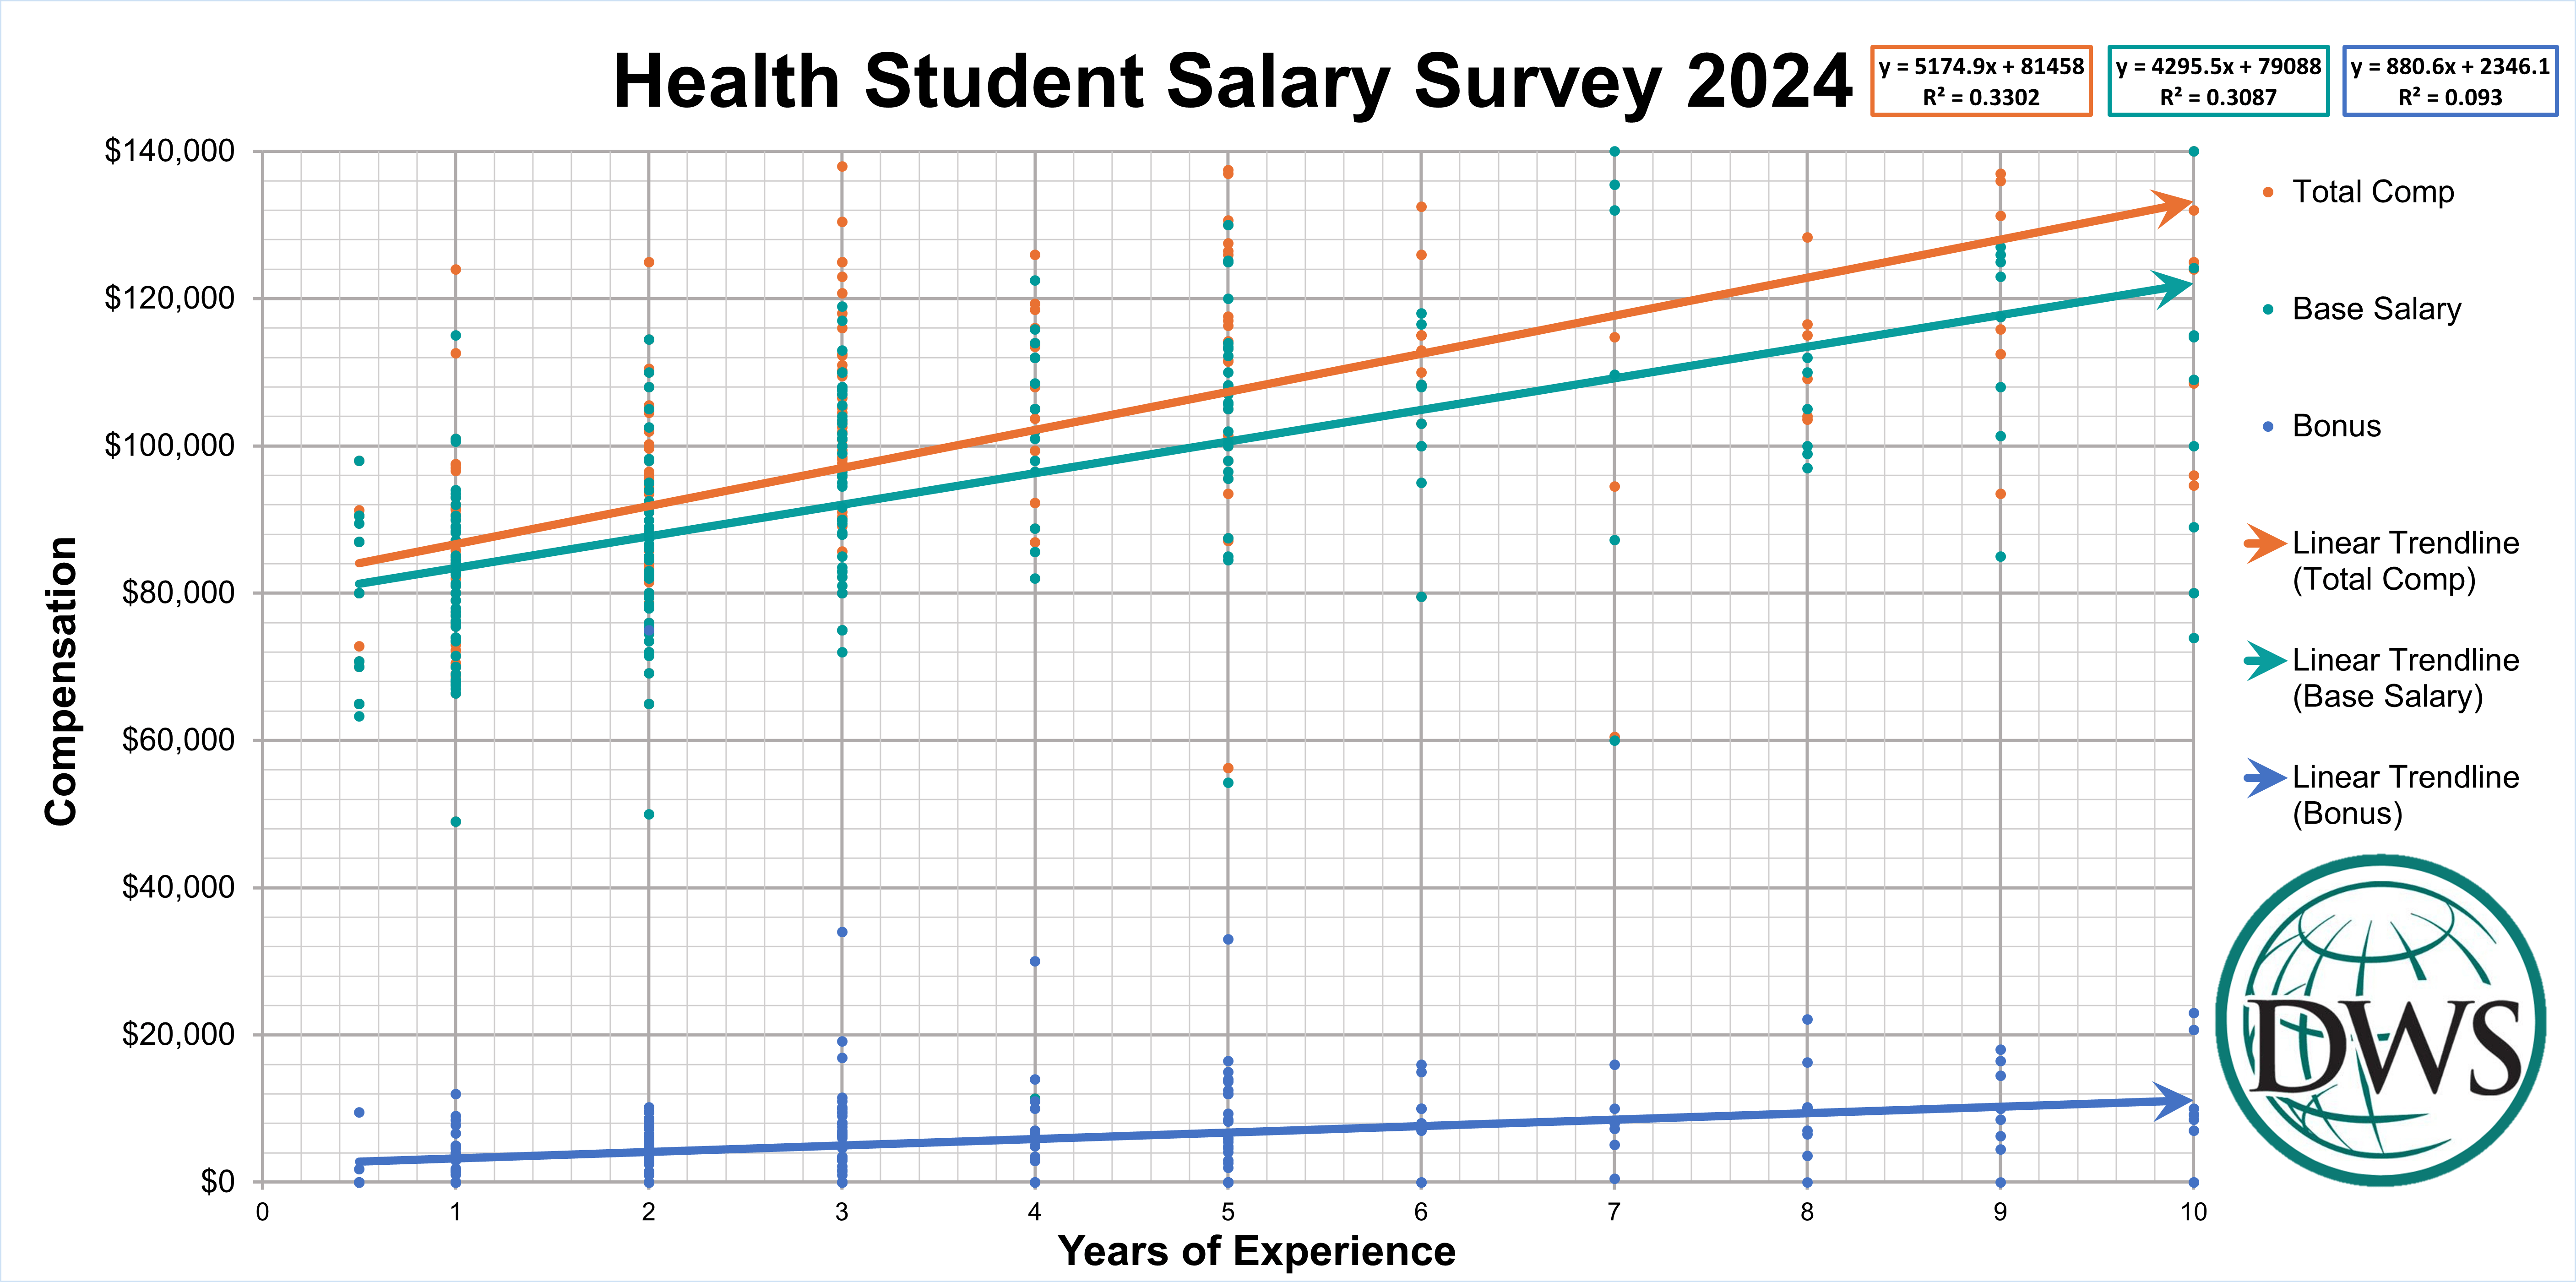
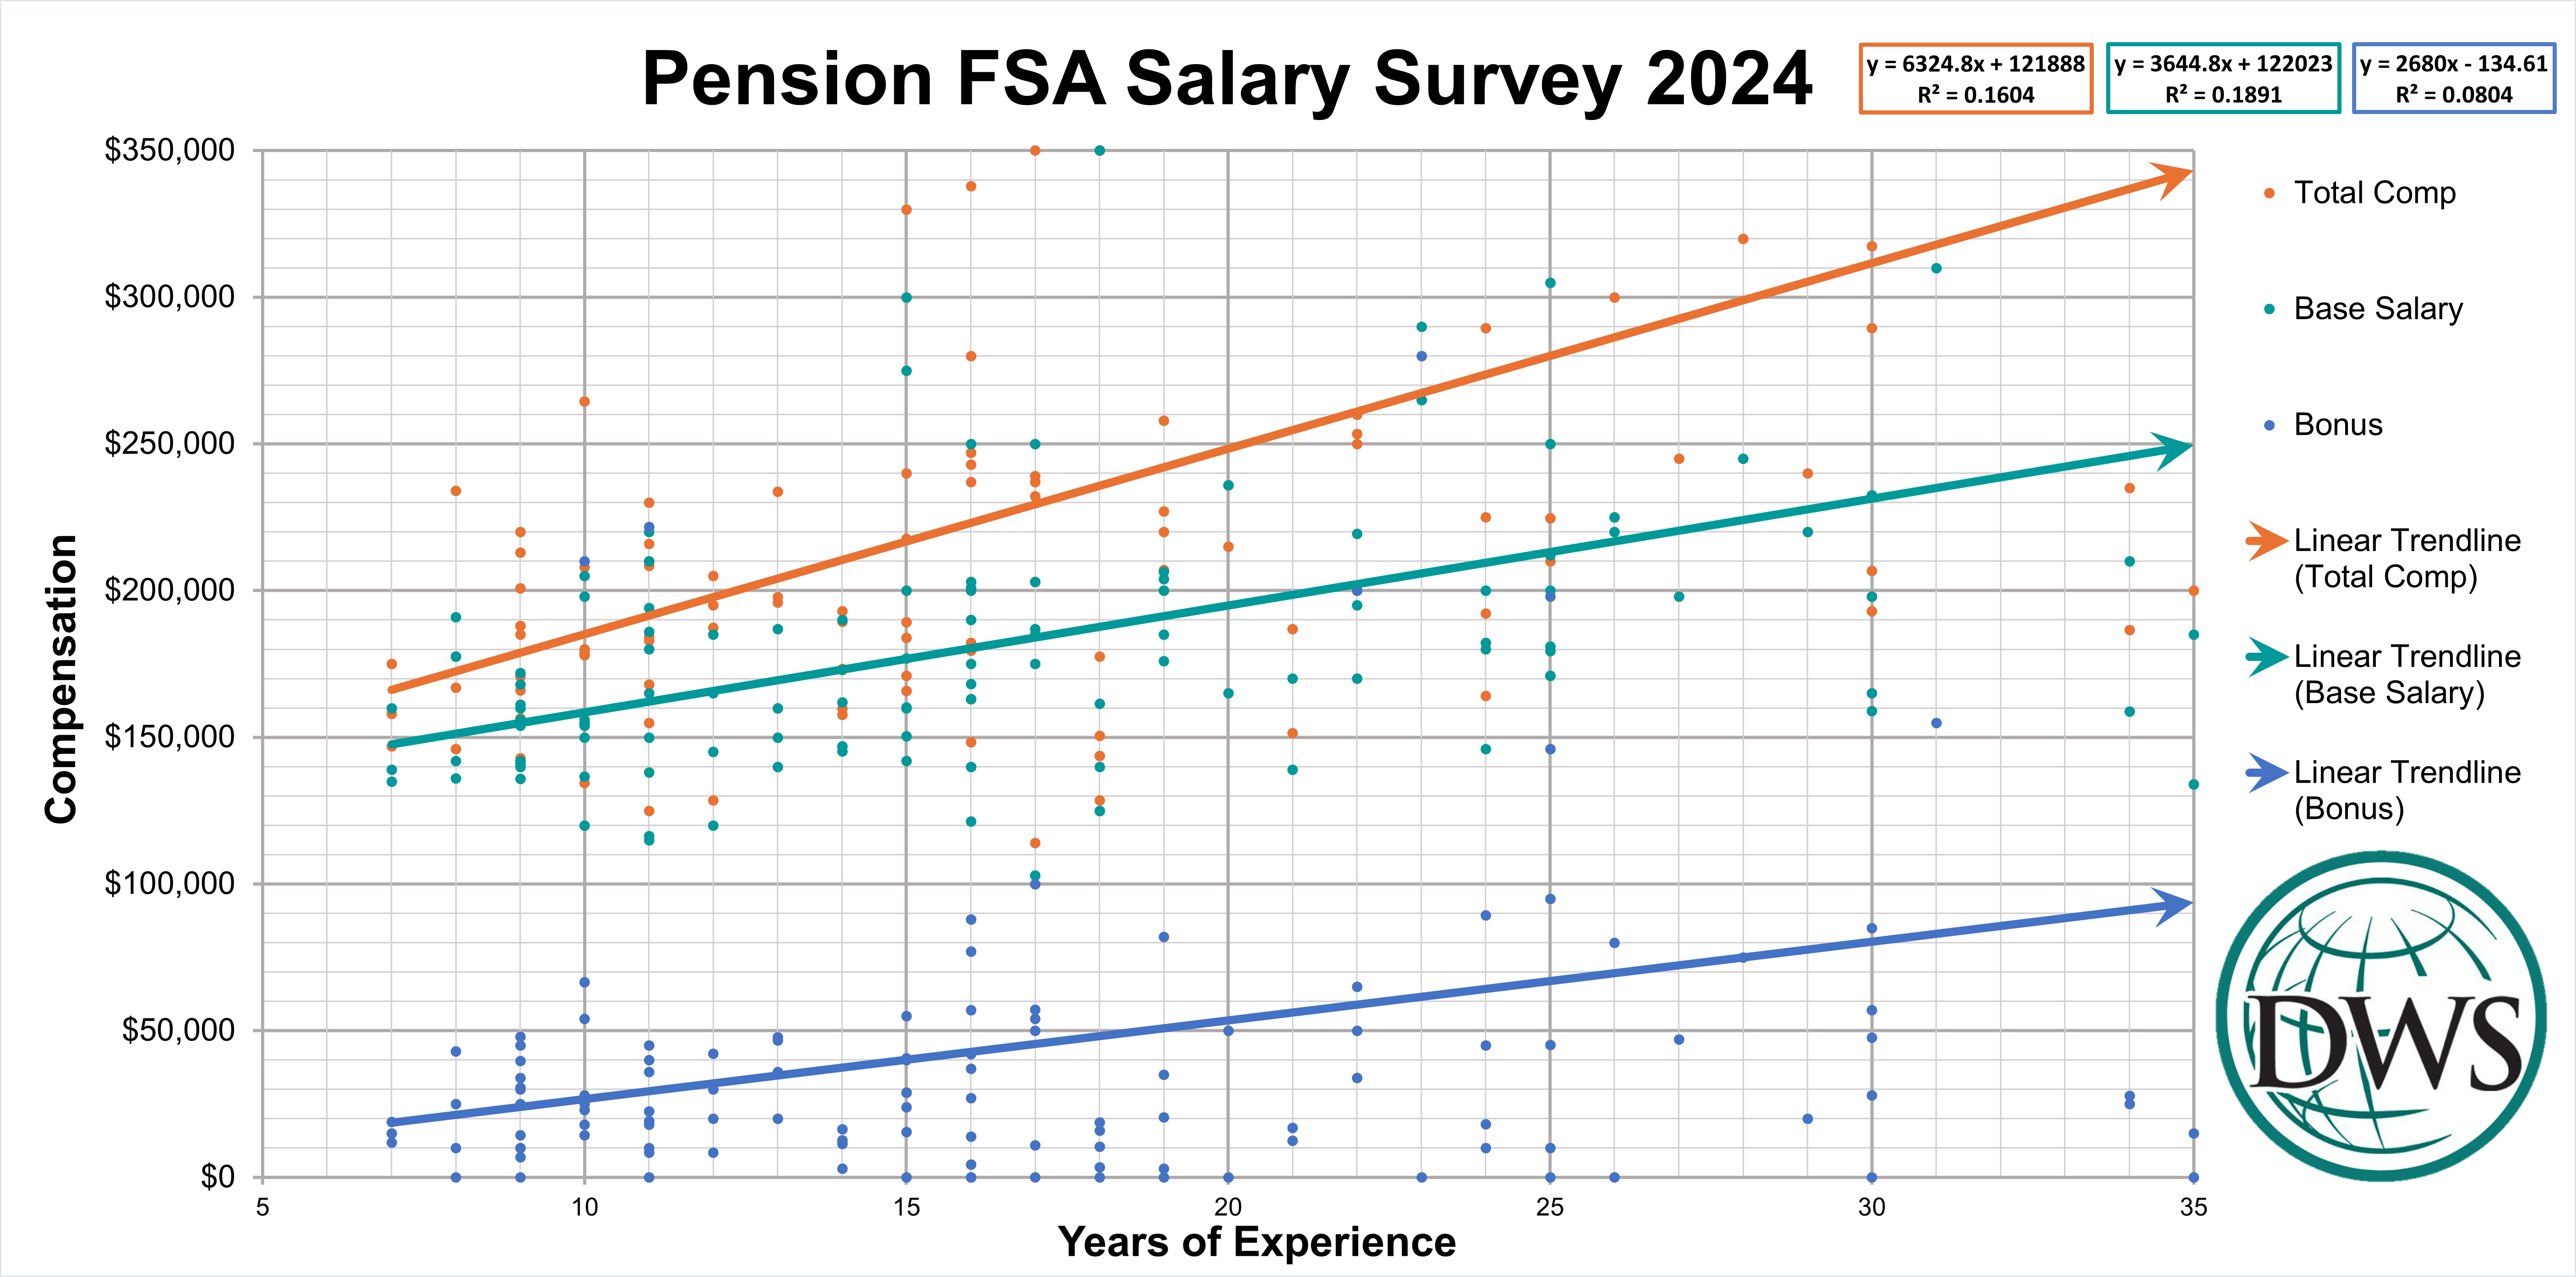
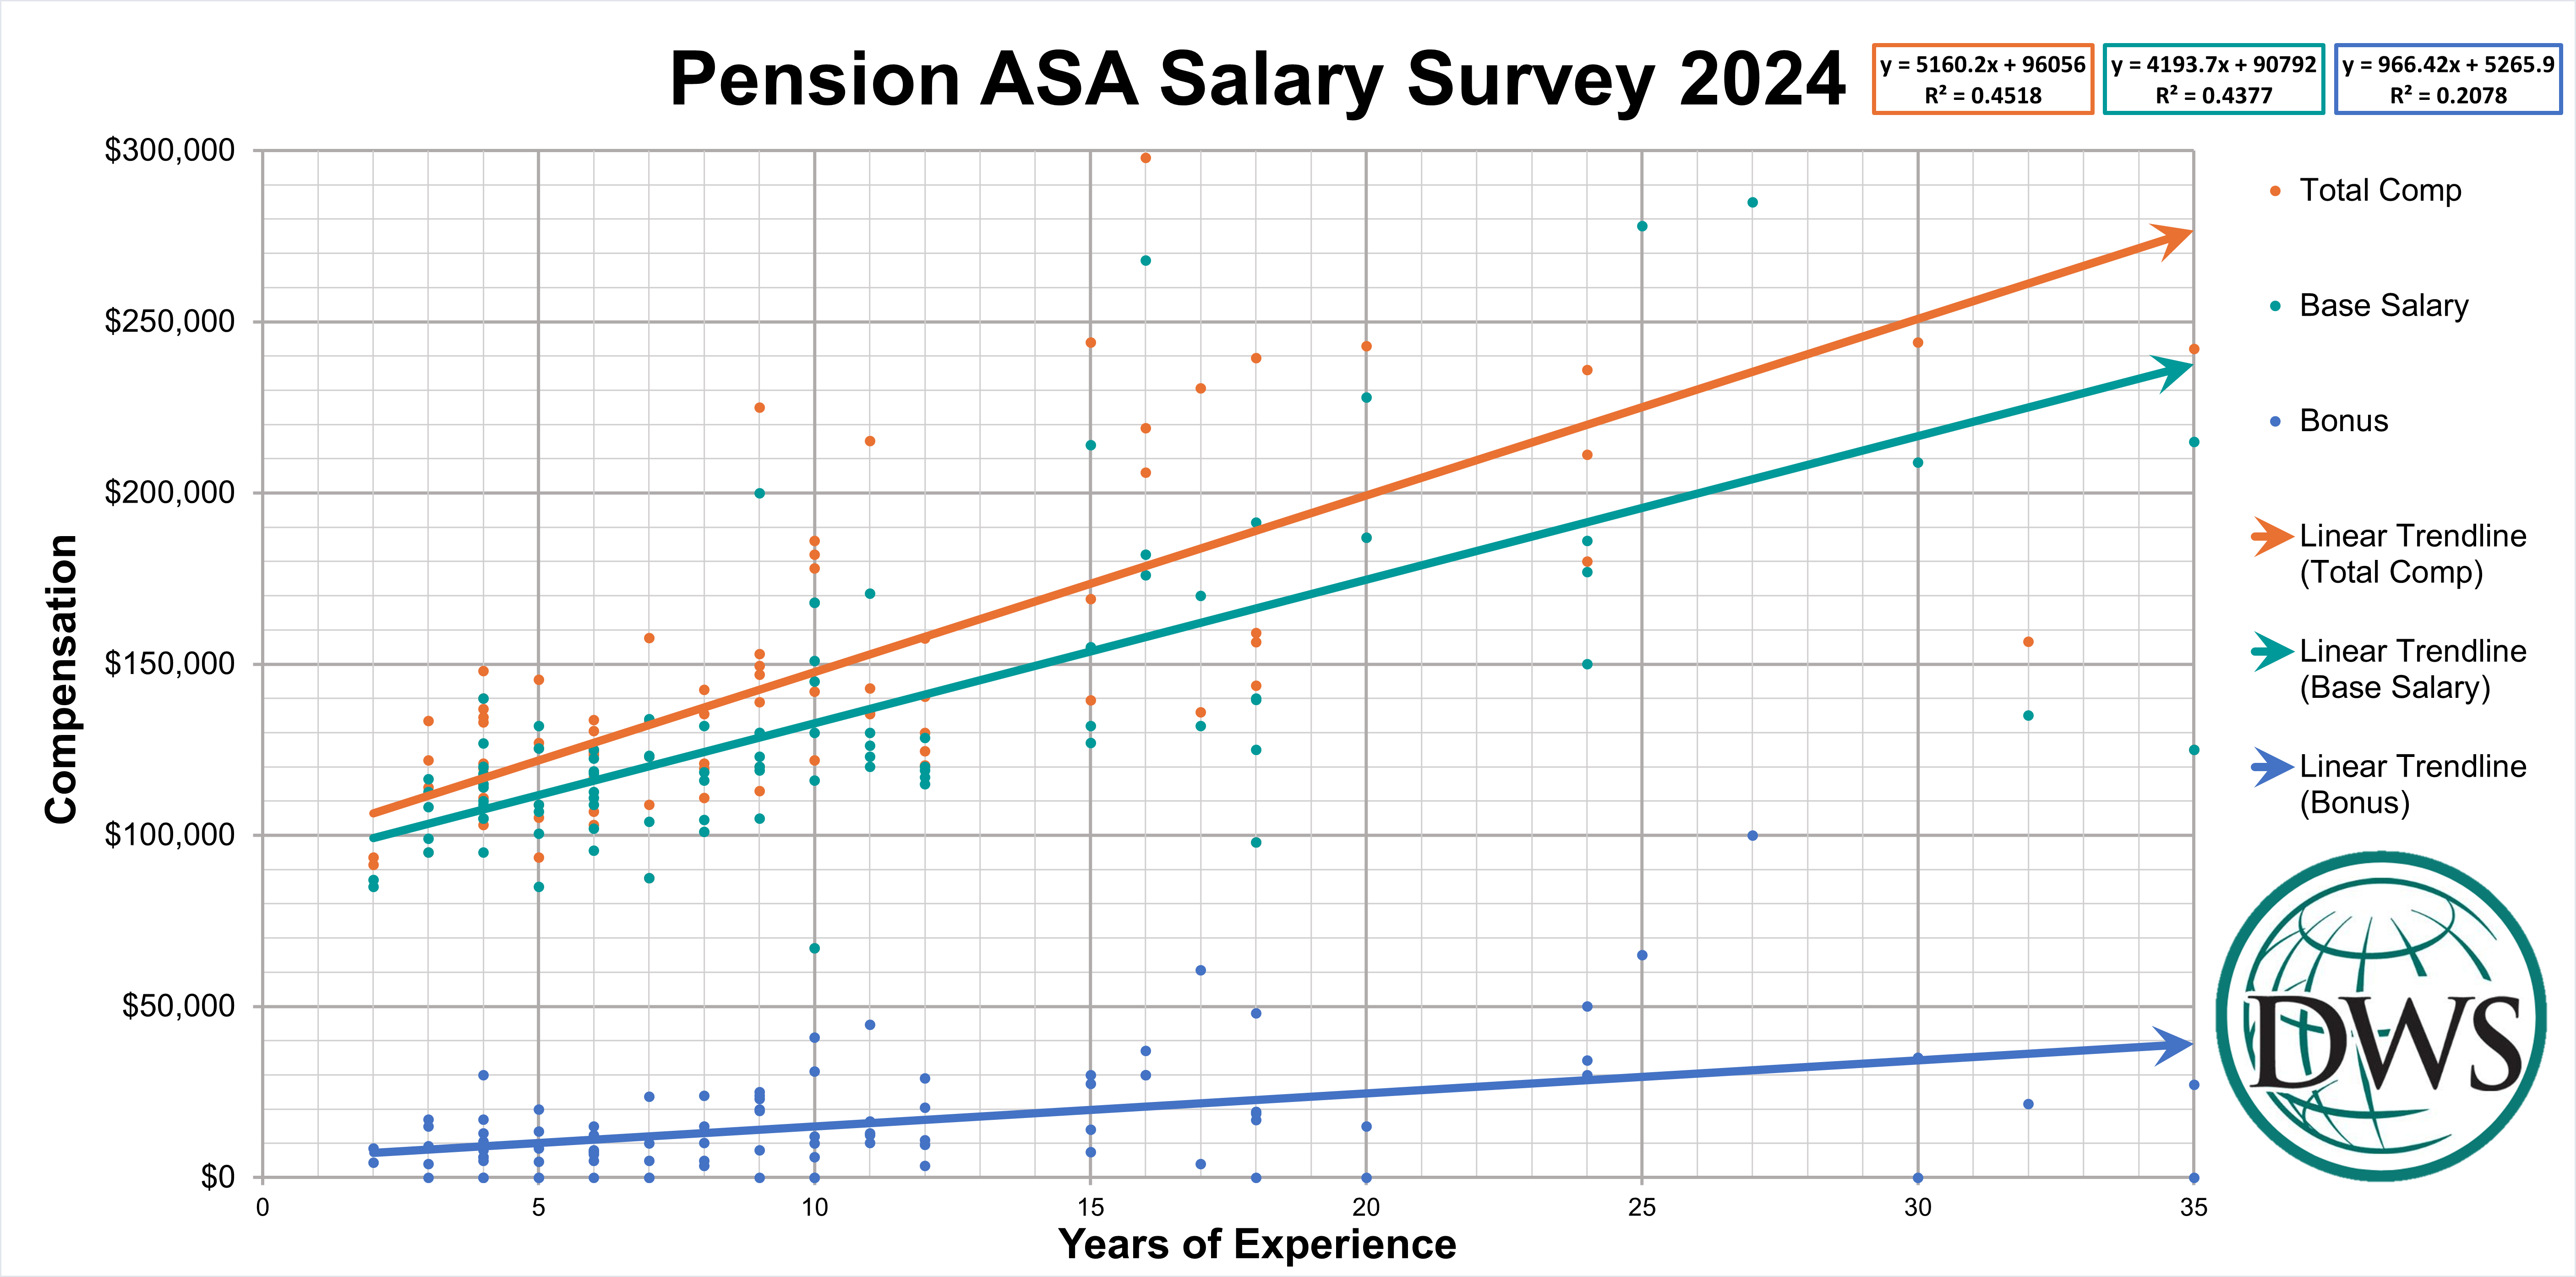
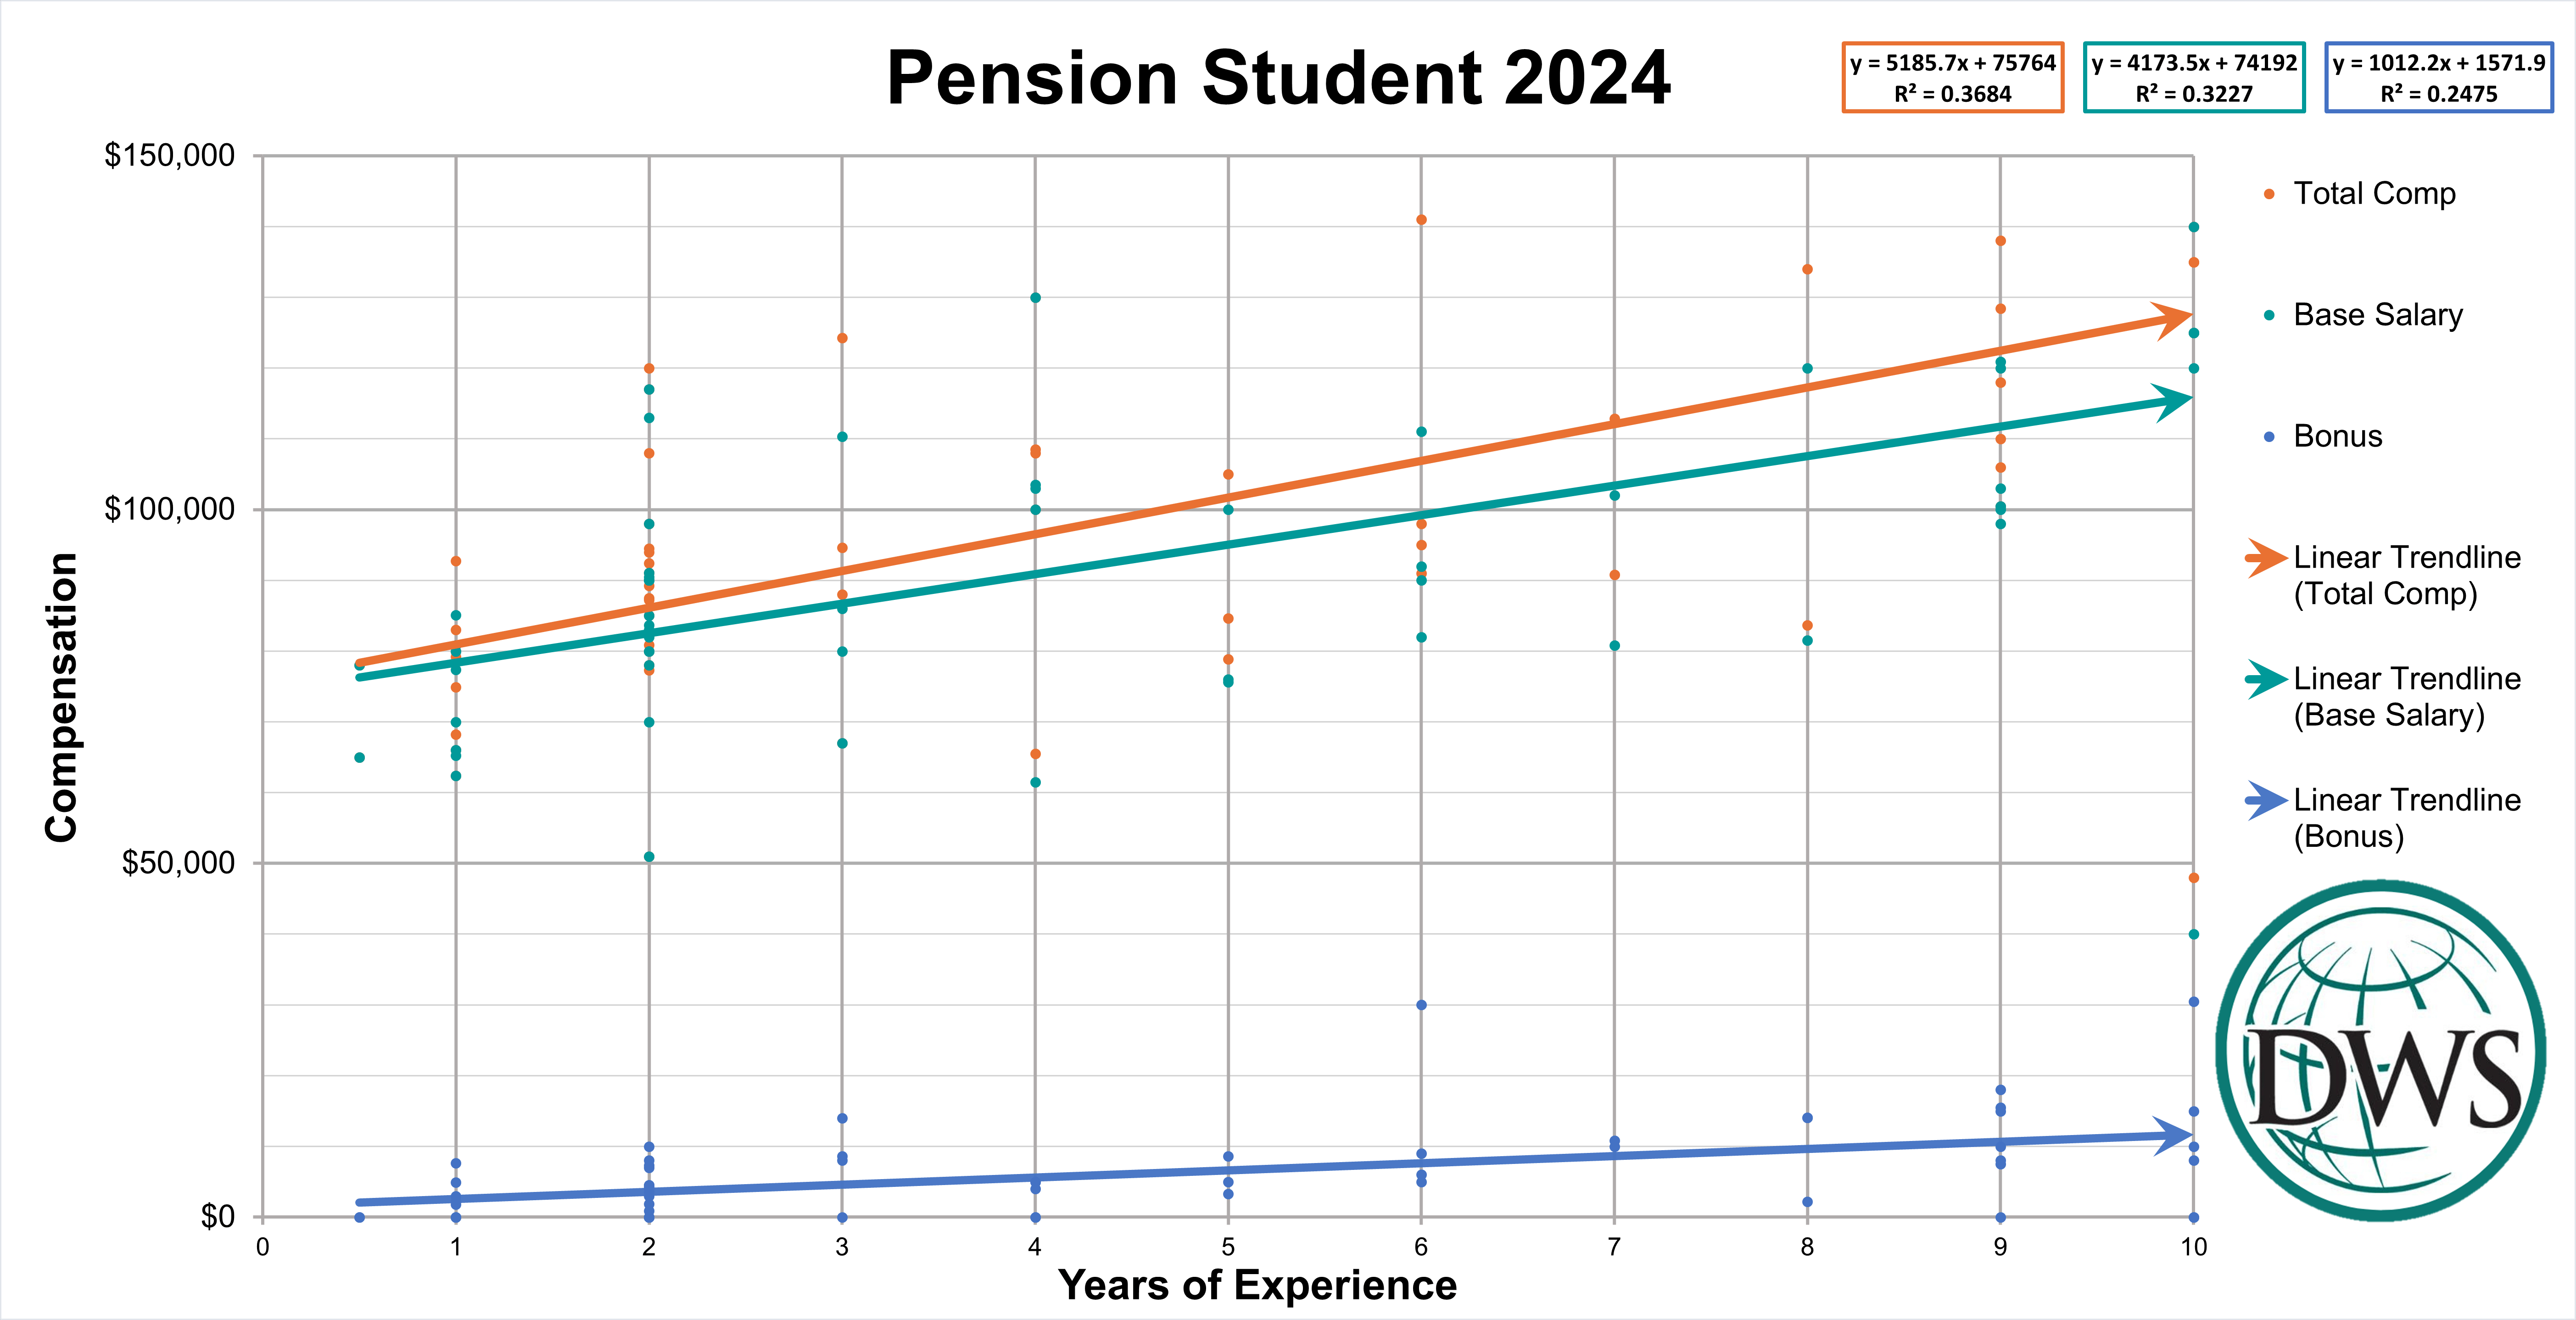
Guide to interpreting the results of the salary surveys:
• The horizontal axis (bottom) represents the years of experience.
• The vertical axis (side) represents the dollar amount of compensation.
• The green, blue and orange dots represent base salary (green), bonus (blue) and total compensation (orange).
• The orange line (total compensation), the green line (base salary), and the blue line (bonus) are the linear trendlines marking the average increase in compensation as someone gains years of experience.